File talk:Fukushima Dosis qtl1.svg
Jump to navigation
Jump to search
See File:Fukushima I accident radiation monitoring.PNG for where I've been doing similar work in parallel. Theanphibian (talk) 16:56, 16 March 2011 (UTC)
Where did the data for this come from? Theanphibian (talk) 17:44, 16 March 2011 (UTC)
- The data is originally from Tepco, I grabbed it from the graph linked in the desc. It seems to run one day longer than yours. Sincerely, --Quartl (talk) 19:07, 16 March 2011 (UTC)
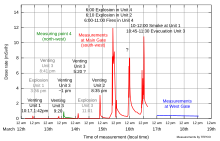
Event labelling in this diagram is partially wrong. Here is the correct data: File:Chart Radiation Fukushima GRS 12 03 2011.JPG
--PM3 (talk) 12:28, 9 May 2011 (UTC)
- Isn't it better to use this graph then (assuming it's not copyrighted)? --Quartl (talk) 13:23, 9 May 2011 (UTC)
- Your one is simpler to understand, and meanwhile I found that the new GRS graph still has some errors:
- First venting of Unit 1 is marked as explosion.
- Burst of Unit 2 suppression chamber is labeled "explosion". NISA says explosion, but Tepco says "an abnormal noise began emanating from nearby Pressure Suppression Chamber". [1] Its very unclear if this really was an explosion.
- Probable second explosion in Block 4 (must have happened that night) is marked as "2nd explosion block 2"
- "relases from block 2 and 3" are unclear, I dont see any proof for this. With regard to the intensity of radiation, look to me more like another burning Unit 4 fuel pool.
- I've done an update of your grap now, hope this is ok. --PM3 (talk) 03:58, 10 May 2011 (UTC)
- Your one is simpler to understand, and meanwhile I found that the new GRS graph still has some errors:
- Of course this is fine with me, it's a wiki after all and you're the expert. I also noted some of the inconsistencies and some spikes don't coincide with known events. Could you mention in the description the points where the graph differs from the source? Thanks, --Quartl (talk) 04:25, 10 May 2011 (UTC)

- Ok. I've made an english translation now, too. The original source you referred to does no longer exist; I will fix the link to an equivalent file at the new GRS page. --PM3 (talk) 05:09, 10 May 2011 (UTC)
- I suppose that even the Tepco measurement data is incomplete, e.g. the Unit 1 venting at about 2 to 2:30 pm on March 12 is missing. For 15:29 pm, Mach 12, Tepco reported radiation at site boundary over 0,5 mSv/h [2]; sources say it was 1,0 mSv/h [3]. That should have given a nice spike in the chart. --PM3 (talk) 05:28, 10 May 2011 (UTC)
- Good translation. Yes, I'm also not sure, how trustworthy the published data really is. I'm sure it's going to be analyzed thoroughly by experts in the future. --Quartl (talk) 06:57, 10 May 2011 (UTC)