File:Younger Dryas-Preboreal boundary on Ngrip 50 dataset.png

Original file (1,527 × 797 pixels, file size: 310 KB, MIME type: image/png)
Captions
Captions
Summary[edit]
| Description |
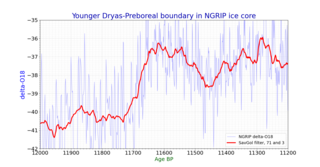
English: This file is GNUPLOT based on subset of NGRIP delta-oxygen data file
Younger Dryas/Preboreal boundary on NGRIP ice core delta-oxygen 18/16 data set ftp://ftp.ncdc.noaa.gov/pub/data/paleo/icecore/greenland/summit/ngrip/isotopes/ngrip-d18o-50yr.txt |
| Date | |
| Source | Own work |
| Author | Merikanto |
Addtitional information[edit]
Source of data is
http://www.iceandclimate.nbi.ku.dk/data/ http://www.iceandclimate.nbi.ku.dk/data/NGRIP_d18O_and_dust_5cm.xls
δ18O values and dust concentrations
The dataset provides NGRIP δ18O
values, dust concentrations, and GICC05 ages in 5cm depth resolution for the
period 0-60 ka (δ18O) and 10-60 ka (dust).
The dataset accompany the following papers:
NGRIP members, Nature, 431, 147-151, 2004. DOI: 10.1038/nature02805
Gkinis et al., Earth Planet. Sci. Lett., 405, 132-141, 2014.  DOI:
10.1016/j.epsl.2014.08.022
Ruth et al., J. Geophys. Res., 108, 4098, 2003. DOI: 4010.1029/2002JD002376
- drawing climate diagram in python 3
- version 2.11
- 11.9.2020
-
import matplotlib.pyplot as plt
import numpy as np
import pandas as pd
from scipy import interpolate
from matplotlib.ticker import (MultipleLocator, AutoMinorLocator)
import scipy.signal
def running_mean(x, N):
   cumsum = np.cumsum(np.insert(x, 0, 0))
   return (cumsum[N:] - cumsum[:-N]) / float(N)
datafilename="ngrip1.csv"
captioni="Younger Dryas-Preboreal boundary in NGRIP ice core"
savename="ngrip_dryas.svg"
figsizex=16
figsizey=8
- x = []
- y = []
- y2= []
dfin0=pd.read_csv(datafilename, sep=";")
lst1=['gicc05_age','delta_O18']
dfin1 = dfin0[dfin0.columns.intersection(lst1)]
x0=dfin1['gicc05_age']
y0=dfin1['delta_O18']
- y20=dfin1['GISP_dO18']
- y30=dfin1['GISP2_dO18']
x=np.array(x0)
y=np.array(y0)
- y2=np.array(y20)
- y3=np.array(y30)
- list1=[]
- list1.append(y)
- list1.append(y2)
- list1.append(y3)
- data1=np.array(list1)
- print (np.shape(data1))
- data_avg1=np.average(data1, axis=0)
- print(x)
- print(y)
- quit(0)
size0=14
size1=16
size2=18
size3=24
- y_savgol = scipy.signal.savgol_filter(y,31, 3)
y_savgol = scipy.signal.savgol_filter(y,71, 3)
- y_running = running_mean(y, 31)
x_sm = np.array(x)
y_sm = np.array(y)
x_smooth = np.linspace(x_sm.min(), x_sm.max(), 20000)
funk1 = interpolate.interp1d(x_sm, y_sm, kind="cubic")
y_smooth = funk1(x_smooth)


fig, ax1 = plt.subplots()
- ax1.axis((11600,14000,0,ymax1))
ax1.set_xlim(11200,12000)
- ax1.set_ylim(-30.0, -45.0)
ax1.set_ylim(-35.0, -42.0)


plt.gca().invert_xaxis()
plt.gca().invert_yaxis()
ax1.set_ylabel('delta-O18', color='#0000ff', fontsize=size2+2)


ax1.plot(x,y, color="#a0a0ff", linewidth=1,label="NGRIP delta-O18")
- ax1.plot(x_smooth,y_smooth, color="#0000ff", linewidth=3,label="NGRIP delta-O18")
ax1.plot(x,y_savgol, color="#FF0000", linewidth=3, label="SavGol filter, 71 and 3")
- ax1.plot(x,y_running, color="#FF0000", linewidth=3)
- ax1.plot(x,data_avg1, color="#ff0000", linewidth=2, linestyle=":", label="Average of NGRIP, GISP, GISP2 delta-O18")
ax1.tick_params(axis='both', which='major', labelsize=size2)
ax1.xaxis.set_minor_locator(MultipleLocator(50))
ax1.xaxis.set_minor_locator(MultipleLocator(10))
ax1.yaxis.set_minor_locator(MultipleLocator(1.0))
ax1.yaxis.set_minor_locator(MultipleLocator(0.1))
ax1.grid(which='major', linestyle='-', linewidth='0.1', color='black')
ax1.grid(which='minor', linestyle=':', linewidth='0.1', color='black')


ax1.set_xlabel('Age BP', color="darkgreen", fontsize=size2)


ax1.set_title(captioni, fontsize=size3, color="#0000af")
plt.legend(fontsize=size0)
fig = plt.gcf()
fig.set_size_inches(figsizex, figsizey, forward=True)


plt.savefig(savename, format="svg", dpi = 100)
plt.show()
Licensing[edit]
- You are free:
- to share – to copy, distribute and transmit the work
- to remix – to adapt the work
- Under the following conditions:
- attribution – You must give appropriate credit, provide a link to the license, and indicate if changes were made. You may do so in any reasonable manner, but not in any way that suggests the licensor endorses you or your use.
- share alike – If you remix, transform, or build upon the material, you must distribute your contributions under the same or compatible license as the original.
File history
Click on a date/time to view the file as it appeared at that time.
| Date/Time | Thumbnail | Dimensions | User | Comment | |
|---|---|---|---|---|---|
| current | 16:56, 12 September 2020 | | 1,527 × 797 (310 KB) | Merikanto (talk | contribs) | New data and layout |
| 12:33, 27 December 2013 |  | 640 × 480 (8 KB) | Merikanto~commonswiki (talk | contribs) | User created page with UploadWizard |
You cannot overwrite this file.
File usage on Commons
There are no pages that use this file.
File usage on other wikis
The following other wikis use this file:
- Usage on ja.wikipedia.org