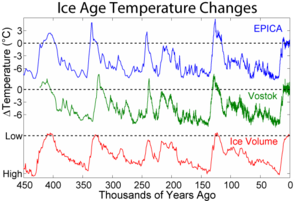
File:Vijf miljoen jaar zuurstofisotopen.svg
From Wikimedia Commons, the free media repository
Jump to navigation
Jump to search

Size of this PNG preview of this SVG file: 672 × 264 pixels. Other resolutions: 320 × 126 pixels | 640 × 251 pixels | 1,024 × 402 pixels | 1,280 × 503 pixels | 2,560 × 1,006 pixels.
Original file (SVG file, nominally 672 × 264 pixels, file size: 177 KB)
File information
Structured data
Captions
Captions
Add a one-line explanation of what this file represents
| DescriptionVijf miljoen jaar zuurstofisotopen.svg |
  |
| Date | (UTC) |
| Source | |
| Author |
|
| This is a retouched picture, which means that it has been digitally altered from its original version. Modifications: redrawn. The original can be viewed here: Five Myr Climate Change.png:
|
I, the copyright holder of this work, hereby publish it under the following licenses:

|
Permission is granted to copy, distribute and/or modify this document under the terms of the GNU Free Documentation License, Version 1.2 only as published by the Free Software Foundation; with no Invariant Sections, no Front-Cover Texts, and no Back-Cover Texts. A copy of the license is included in the section entitled GNU Free Documentation License. | 1.2 onlyhttp://www.gnu.org/licenses/old-licenses/fdl-1.2.htmlGFDL 1.2GNU Free Documentation License 1.2truetrue |
You may select the license of your choice.
Original upload log[edit]
This image is a derivative work of the following images:
- File:Five_Myr_Climate_Change.png licensed with GFDL-1.2, GFDL-1.2
- 2005-12-07T10:27:24Z Joonasl 745x224 (22795 Bytes) Climate changes over the last 5 million years. Diagram by [http://fi.wikipedia.org/wiki/K%C3%A4ytt%C3%A4j%C3%A4:Merikanto Merikanto] {{GFDL}} [[Category:Global warming]]
Uploaded with derivativeFX
File history
Click on a date/time to view the file as it appeared at that time.
| Date/Time | Thumbnail | Dimensions | User | Comment | |
|---|---|---|---|---|---|
| current | 16:38, 12 February 2009 | 672 × 264 (177 KB) | Tom Meijer (talk | contribs) | {{Information |Description=thumb|300px|right|Expansion of changes during the recent sequence of glacials and interglacials [[Image:65 Myr Climate Change.png|thumb|300px|right|Climate change during the last 65 million year |
You cannot overwrite this file.
File usage on Commons
There are no pages that use this file.
File usage on other wikis
The following other wikis use this file:
- Usage on nl.wikipedia.org