File:Usage share of web browsers.png
From Wikimedia Commons, the free media repository
Jump to navigation
Jump to search
Usage_share_of_web_browsers.png (450 × 490 pixels, file size: 22 KB, MIME type: image/png)
File information
Structured data
Captions
Captions
Add a one-line explanation of what this file represents
Summary[edit]

|
This graph image could be re-created using vector graphics as an SVG file. This has several advantages; see Commons:Media for cleanup for more information. If an SVG form of this image is available, please upload it and afterwards replace this template with
{{vector version available|new image name}}.
It is recommended to name the SVG file “Usage share of web browsers.svg”—then the template Vector version available (or Vva) does not need the new image name parameter. |

|
This image shows some kind of simple graph/chart that could be converted to a Wikichart. Storing graphs or charts as images makes it harder to change (correct or translate) them. Wikicharts also help making sure to be consistent in font and size. |
|
English ∙ español ∙ français ∙ Deutsch ∙ polski ∙ македонски ∙ slovenščina +/− | |
| DescriptionUsage share of web browsers.png |
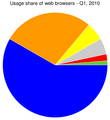
English: Usage share of web browsers for July 2010 as a pie chart. |
| Date | |
| Source | This chart was created using the Google Chart API and data from here, with the following URL: http://chart.apis.google.com/chart?chtt=Usage+share+of+web+browsers+-+July+2010&chts=000000,20&chs=450x490&chf=bg,s,ffffff&cht=p&chd=t:52.68,30.69,9.80,5.09,1.91&chco=0000ff,ffff00,00ff00,00ffff,ff0000 |
| Author | Iyyo, Groggy Dice |
| Other versions | This follows an earlier image on English Wikipedia created by Groggy Dice. |
Legend[edit]
Licensing[edit]
Since Koavf and Groggy Dice put their images into the public domain, I have done the same.
| Public domainPublic domainfalsefalse |
| I, the copyright holder of this work, release this work into the public domain. This applies worldwide. In some countries this may not be legally possible; if so: I grant anyone the right to use this work for any purpose, without any conditions, unless such conditions are required by law. |
File history
Click on a date/time to view the file as it appeared at that time.
| Date/Time | Thumbnail | Dimensions | User | Comment | |
|---|---|---|---|---|---|
| current | 09:34, 21 August 2010 |  | 450 × 490 (22 KB) | Iyyo (talk | contribs) | Update. |
| 10:32, 4 February 2010 |  | 450 × 490 (21 KB) | Iyyo (talk | contribs) | Update. | |
| 22:22, 4 January 2010 |  | 450 × 490 (21 KB) | Iyyo (talk | contribs) | Update to Q1 2010 stats. | |
| 00:34, 16 November 2009 |  | 450 × 490 (21 KB) | Iyyo (talk | contribs) | Q4 2009. | |
| 20:35, 1 February 2009 |  | 450 × 490 (21 KB) | Iyyo (talk | contribs) | February 2009 statistics. | |
| 06:03, 20 January 2009 |  | 450 × 490 (21 KB) | Groggy Dice (talk | contribs) | slightly incorrect earlier image (transposed 69.80 to 68.90) Category:Web browsers | |
| 05:36, 20 January 2009 |  | 450 × 490 (21 KB) | Groggy Dice (talk | contribs) | change from December results to Q4 results | |
| 09:35, 4 January 2009 |  | 450 × 490 (21 KB) | Iyyo (talk | contribs) | {{Information |Description=Usage share of web browsers for Q1 2009 as a pie chart. |Source=This chart was created using the [http://code.google.com/apis/chart/ Google Chart API] and data from [http://marketshare.hitslink.com/report.aspx?qprid=0&qptimefram |
You cannot overwrite this file.
File usage on Commons
There are no pages that use this file.
