File:US incarceration timeline-clean.svg
Jump to navigation
Jump to search

Size of this PNG preview of this SVG file: 693 × 464 pixels. Other resolutions: 320 × 214 pixels | 640 × 429 pixels | 1,024 × 686 pixels | 1,280 × 857 pixels | 2,560 × 1,714 pixels.
Original file (SVG file, nominally 693 × 464 pixels, file size: 11 KB)
Captions
Captions
Add a one-line explanation of what this file represents
Source[edit]
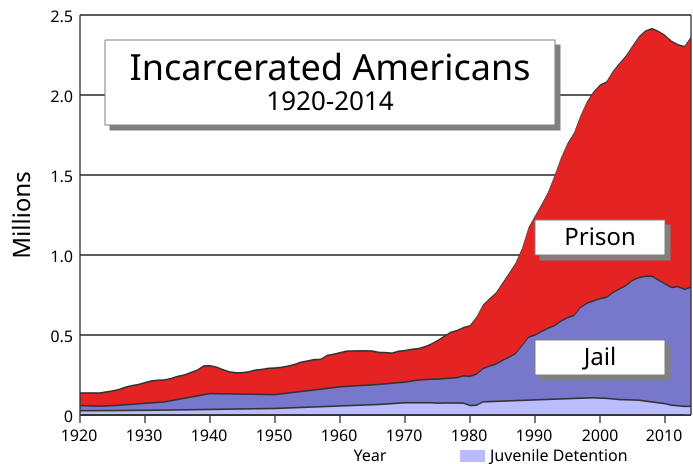
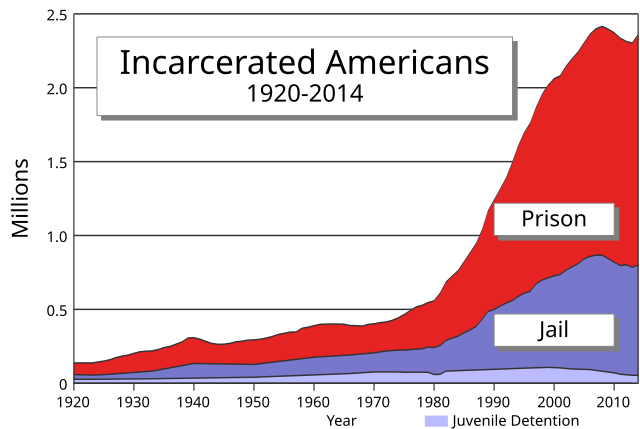
| Description | 1920 to 2014. Timeline of total number of inmates in U.S. prisons, jails, and juvenile facilities. See data chart below. | ||
| Date | - date of original file here on the Commons. | ||
| Source |
References:
More resources:
|
||
| Author |
Original image on top from which the following images were derived. Latest authors on bottom.
|
||
| SVG development | This W3C-invalid chart was created with an unknown SVG tool. This chart is translated using SVG switch elements: all translations are stored in the same file.
|

| Table 1. From the PDF for: Correctional Populations In The United States, 2014 (NCJ 249513). BJS. | |||||||
|---|---|---|---|---|---|---|---|
| Estimated number of persons supervised by U.S. adult correctional systems, by correctional status, 2000, 2005–2010, and 2013–2014 | |||||||
| Year | Total correctional population | Community supervision | Incarcerated | ||||
| Total | Probation | Parole | Total | Local jail | Prison | ||
| 2000 | 6,467,800 | 4,564,900 | 3,839,400 | 725,500 | 1,945,400 | 621,100 | 1,394,200 |
| 2005 | 7,055,600 | 4,946,600 | 4,162,300 | 784,400 | 2,200,400 | 747,500 | 1,525,900 |
| 2006 | 7,199,700 | 5,035,000 | 4,236,800 | 798,200 | 2,256,600 | 765,800 | 1,568,700 |
| 2007 | 7,339,600 | 5,119,000 | 4,293,000 | 826,100 | 2,296,400 | 780,200 | 1,596,800 |
| 2008 | 7,313,600 | 5,094,400 | 4,270,100 | 828,200 | 2,310,300 | 785,500 | 1,608,300 |
| 2009 | 7,235,200 | 5,015,900 | 4,196,200 | 824,100 | 2,297,700 | 767,400 | 1,615,500 |
| 2010 | 7,086,500 | 4,886,000 | 4,053,600 | 840,700 | 2,279,100 | 748,700 | 1,613,800 |
| 2013 | 6,903,200 | 4,753,400 | 3,910,600 | 855,200 | 2,222,500 | 731,200 | 1,577,000 |
| 2014 | 6,851,000 | 4,708,100 | 3,864,100 | 856,900 | 2,224,400 | 744,600 | 1,561,500 |
Data chart[edit]
The data chart is as follows:
| Year | Juvenile Detention |
Jail | Prison | Total |
|---|---|---|---|---|
| 1910 | 25,422 | 43,627 | 68,735 | 137,800 |
| 1920 | 137,400 | |||
| 1923 | 27,238 | 28,140 | 81,959 | 137,337 |
| 1925 | 91,669 | 150,000 | ||
| 1926 | 97,991 | 159,300 | ||
| 1927 | 109,346 | 173,600 | ||
| 1928 | 116,390 | 183,600 | ||
| 1929 | 120,496 | 190,600 | ||
| 1930 | 129,453 | 202,500 | ||
| 1931 | 137,082 | 213,100 | ||
| 1932 | 137,997 | 217,000 | ||
| 1933 | 30,496 | 51,436 | 136,810 | 218,742 |
| 1934 | 138,316 | 227,700 | ||
| 1935 | 144,180 | 241,000 | ||
| 1936 | 145,038 | 249,300 | ||
| 1937 | 152,741 | 264,400 | ||
| 1938 | 160,285 | 279,400 | ||
| 1939 | 179,818 | 306,400 | ||
| 1940 | 99,249 | 173,706 | 307,700 | |
| 1941 | 165,439 | 298,800 | ||
| 1942 | 150,384 | 283,100 | ||
| 1943 | 137,220 | 269,200 | ||
| 1944 | 132,456 | 263,800 | ||
| 1945 | 133,649 | 264,300 | ||
| 1946 | 140,079 | 270,100 | ||
| 1947 | 151,304 | 280,700 | ||
| 1948 | 155,977 | 284,700 | ||
| 1949 | 163,749 | 291,800 | ||
| 1950 | 40,880 | 86,492 | 166,123 | 293,495 |
| 1951 | 165,680 | 297,900 | ||
| 1952 | 168,233 | 305,400 | ||
| 1953 | 173,579 | 315,600 | ||
| 1954 | 182,901 | 329,800 | ||
| 1955 | 185,780 | 337,600 | ||
| 1956 | 189,565 | 346,200 | ||
| 1957 | 185,414 | 347,000 | ||
| 1958 | 205,643 | 372,100 | ||
| 1959 | 208,105 | 379,400 | ||
| 1960 | 56,516 | 119,671 | 212,953 | 389,140 |
| 1961 | 220,149 | 402,000 | ||
| 1962 | 218,830 | 406,400 | ||
| 1963 | 217,283 | 410,500 | ||
| 1964 | 214,336 | 413,200 | ||
| 1965 | 210,895 | 415,500 | ||
| 1966 | 65,875 | 199,654 | 409,900 | |
| 1967 | 194,896 | 412,000 | ||
| 1968 | 187,914 | 411,800 | ||
| 1969 | 196,007 | 426,800 | ||
| 1970 | 76,729 | 129,189 | 196,429 | 402,347 |
| 1971 | 198,061 | 410,200 | ||
| 1972 | 141,588 | 196,092 | 414,400 | |
| 1973 | 204,211 | 425,300 | ||
| 1974 | 76,671 | 218,466 | 442,300 | |
| 1975 | 74,270 | 240,593 | 464,900 | |
| 1976 | 262,833 | 490,400 | ||
| 1977 | 75,297 | 285,456 | 516,300 | |
| 1978 | 158,394 | 294,396 | 527,500 | |
| 1979 | 74,113 | 301,470 | 545,900 | |
| 1980 | 59,414 | 182,288 | 315,964 | 557,666 |
| 1981 | 60,512 | 195,085 | 353,673 | 609,270 |
| 1982 | 82,272 | 207,853 | 395,516 | 685,641 |
| 1983 | 221,815 | 419,346 | 725,000 | |
| 1984 | 233,018 | 443,398 | 761,700 | |
| 1985 | 254,986 | 480,568 | 822,400 | |
| 1986 | 272,736 | 522,084 | 883,200 | |
| 1987 | 294,092 | 560,812 | 944,800 | |
| 1988 | 341,893 | 603,732 | 1,037,000 | |
| 1989 | 393,303 | 680,907 | 1,167,100 | |
| 1990 | 405,320 | 739,980 | 1,239,700 | |
| 1991 | 426,479 | 789,612 | 1,312,000 | |
| 1992 | 444,584 | 846,277 | 1,388,300 | |
| 1993 | 459,804 | 932,074 | 1,490,900 | |
| 1994 | 486,474 | 1,016,691 | 1,603,700 | |
| 1995 | 507,044 | 1,085,022 | 1,694,100 | |
| 1996 | 518,492 | 1,137,722 | 1,759,800 | |
| 1997 | 105,055 | 567,079 | 1,194,334 | 1,866,468 |
| 1998 | 592,462 | 1,256,474 | 1,955,200 | |
| 1999 | 107,493 | 605,943 | 1,304,081 | 2,017,517 |
| 2000 | 621,149 | 1,334,174 | 2,061,200 | |
| 2001 | 104,219 | 631,240 | 1,345,217 | 2,080,676 |
| 2002 | 665,475 | 1,380,516 | 2,146,400 | |
| 2003 | 96,531 | 691,301 | 1,408,361 | 2,196,193 |
| 2004 | 713,990 | 1,433,728 | 2,243,000 | |
| 2005 | 747,529 | 1,462,866 | 2,304,400 | |
| 2006 | 92,721 | 766,010 | 1,504,598 | 2,363,329 |
| 2007 | 86,814 | 780,174 | 1,532,851 | 2,399,839 |
| 2008 | 785,556 | 1,547,742 | 2,414,800 | |
| 2009 | 767,434 | 1,553,574 | 2,397,100 | |
| 2010 | 70,793 | 748,728 | 1,552,669 | 2,372,190 |
| 2011 | 61,423 | 735,601 | 1,538,847 | 2,335,871 |
| 2012 | 744,524 | 1,511,480 | 2,313,800 | |
| 2013 | 54,148 | 731,208 | 1,516,879 | 2,302,235 |
| 2014 | 744,592 | 1,561,500 | 2,360,240 |
| This work has been released into the public domain by its author, Sarefo. This applies worldwide. In some countries this may not be legally possible; if so: Sarefo grants anyone the right to use this work for any purpose, without any conditions, unless such conditions are required by law.
|
Original upload log[edit]
This image is a derivative work of the following images:
- File:US_incarceration_timeline-clean.gif licensed with PD-author
- 2008-07-06T19:54:39Z Apoc2400 694x486 (17299 Bytes) This version does not include reference to the War on Drugs. To be used on pages unrelated to drugs. {{Information |Description=Timeline of total number of inmates in U.S. prisons, jails, and juvenile facilities. From 1920 t
Uploaded with derivativeFX
File history
Click on a date/time to view the file as it appeared at that time.
| Date/Time | Thumbnail | Dimensions | User | Comment | |
|---|---|---|---|---|---|
| current | 19:22, 4 June 2019 | | 693 × 464 (11 KB) | TFerenczy (talk | contribs) | cs correction |
| 17:28, 28 January 2016 |  | 693 × 464 (12 KB) | Delphi234 (talk | contribs) | update | |
| 01:58, 26 June 2015 |  | 693 × 464 (12 KB) | Delphi234 (talk | contribs) | correction | |
| 07:54, 29 May 2015 |  | 693 × 464 (12 KB) | Delphi234 (talk | contribs) | update | |
| 09:31, 31 October 2014 |  | 693 × 464 (23 KB) | Delphi234 (talk | contribs) | correction | |
| 09:14, 31 October 2014 |  | 693 × 464 (23 KB) | Delphi234 (talk | contribs) | update | |
| 13:23, 28 June 2014 |  | 693 × 464 (23 KB) | Delphi234 (talk | contribs) | fix legend | |
| 13:16, 28 June 2014 |  | 693 × 464 (23 KB) | Delphi234 (talk | contribs) | update | |
| 11:02, 28 July 2009 |  | 693 × 464 (223 KB) | Sarefo (talk | contribs) | {{Information |Description=Timeline of total number of inmates in U.S. prisons, jails, and juvenile facilities. From 1920 to 2006. Data sources: [http://www.nationalinstituteofcorrections.gov/Library/015837] [http://www.ojp.usdoj.gov/bjs/pub/pdf/p06.pdf] |
You cannot overwrite this file.
File usage on Commons
The following 2 pages use this file:
File usage on other wikis
The following other wikis use this file:
- Usage on az.wikipedia.org
- Usage on bn.wikipedia.org
- Usage on bs.wikipedia.org
- Usage on ca.wikipedia.org
- Usage on cs.wikipedia.org
- Usage on da.wikipedia.org
- Usage on de.wikipedia.org
- Usage on en.wikipedia.org
- Punishment
- Violent Crime Control and Law Enforcement Act
- Incarceration in the United States
- Crack epidemic in the United States
- Crime in the United States
- United States incarceration rate
- Talk:Alvin Greene
- Talk:Alvin Greene/Archive 1
- Alternatives to imprisonment
- User:Mlstek/sandbox
- Comparison of United States incarceration rate with other countries
- User:Broady.3/sandbox
- User:44Nifty/sandbox
- User:Timeshifter/Archive 2
- Usage on en.wikiquote.org
- Usage on es.wikipedia.org
- Usage on fr.wikipedia.org
- Usage on he.wikipedia.org
- Usage on id.wikipedia.org
- Usage on it.wikipedia.org
- Usage on tr.wikipedia.org
- Usage on vi.wikipedia.org