File:US Election08-12shift.png
Jump to navigation
Jump to search

Size of this preview: 776 × 600 pixels. Other resolutions: 311 × 240 pixels | 621 × 480 pixels | 994 × 768 pixels | 1,280 × 989 pixels | 1,650 × 1,275 pixels.
Original file (1,650 × 1,275 pixels, file size: 150 KB, MIME type: image/png)
Captions
Captions
Add a one-line explanation of what this file represents
Summary[edit]
| Description |
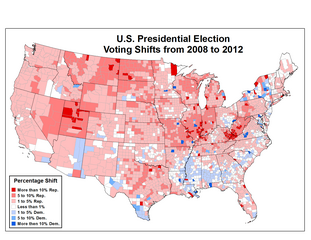
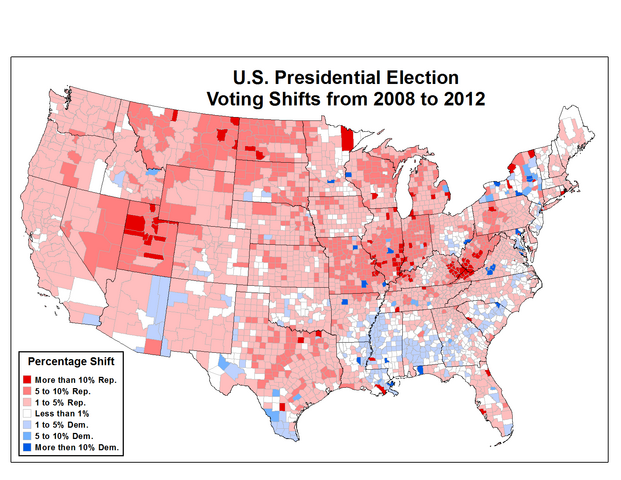
English: This map shows the shift in voting patterns from the 2008 U.S. presidential election and the 2012 U.S. presidential election. |
| Date | |
| Source | Own work, State and county boundaries from the National Atlas. Voting results are as reported by USA Today and compiled by Mark Newman, Department of Physics and Center for the Study of Complex Systems, University of Michigan. |
| Author | Kmusser |
Licensing[edit]
I, the copyright holder of this work, hereby publish it under the following license:
This file is licensed under the Creative Commons Attribution-Share Alike 3.0 Unported license.
- You are free:
- to share – to copy, distribute and transmit the work
- to remix – to adapt the work
- Under the following conditions:
- attribution – You must give appropriate credit, provide a link to the license, and indicate if changes were made. You may do so in any reasonable manner, but not in any way that suggests the licensor endorses you or your use.
- share alike – If you remix, transform, or build upon the material, you must distribute your contributions under the same or compatible license as the original.
File history
Click on a date/time to view the file as it appeared at that time.
| Date/Time | Thumbnail | Dimensions | User | Comment | |
|---|---|---|---|---|---|
| current | 02:30, 6 May 2013 | | 1,650 × 1,275 (150 KB) | Kmusser (talk | contribs) | fix New England data |
| 17:47, 27 April 2013 |  | 1,650 × 1,275 (151 KB) | Kmusser (talk | contribs) | User created page with UploadWizard |
You cannot overwrite this file.
File usage on Commons
The following page uses this file:
File usage on other wikis
The following other wikis use this file:
- Usage on en.wikipedia.org
- Usage on nl.wikipedia.org