File:US Election04-08shift.png
Jump to navigation
Jump to search

Size of this preview: 800 × 513 pixels. Other resolutions: 320 × 205 pixels | 640 × 411 pixels | 1,024 × 657 pixels | 1,583 × 1,016 pixels.
Original file (1,583 × 1,016 pixels, file size: 84 KB, MIME type: image/png)
Captions
Captions
Add a one-line explanation of what this file represents
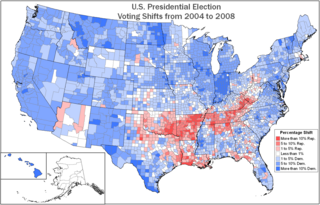
| Description | This map shows the shift in voting patterns from the 2004 U.S. presidential election and the 2008 U.S. presidential election. |
| Date | |
| Source | Map is self-created. State and county boundaries from the National Atlas. Voting results are as reported by USA Today and compiled by Mark Newman, Department of Physics and Center for the Study of Complex Systems, University of Michigan. Alaska is based on state-wide rather than county data. |
| Author | Kmusser (talk) |
| Other versions | File:US Election04-08shift.svg |
I, the copyright holder of this work, hereby publish it under the following license:
This file is licensed under the Creative Commons Attribution-Share Alike 3.0 Unported license.
- You are free:
- to share – to copy, distribute and transmit the work
- to remix – to adapt the work
- Under the following conditions:
- attribution – You must give appropriate credit, provide a link to the license, and indicate if changes were made. You may do so in any reasonable manner, but not in any way that suggests the licensor endorses you or your use.
- share alike – If you remix, transform, or build upon the material, you must distribute your contributions under the same or compatible license as the original.
File history
Click on a date/time to view the file as it appeared at that time.
| Date/Time | Thumbnail | Dimensions | User | Comment | |
|---|---|---|---|---|---|
| current | 14:51, 19 September 2016 | | 1,583 × 1,016 (84 KB) | Mrsocial99mfine (talk | contribs) | Applied lossless compression using PNGGauntlet v3.1.2.0 |
| 17:43, 27 April 2013 |  | 1,583 × 1,016 (171 KB) | Kmusser (talk | contribs) | removed scale bars, they were not correct. | |
| 17:33, 16 December 2009 |  | 1,583 × 1,016 (190 KB) | Kmusser (talk | contribs) | correction to Florida, a bunch of the counties were mismatched, also increase resolution. | |
| 15:21, 23 February 2009 |  | 1,000 × 640 (531 KB) | Kmusser (talk | contribs) | {{Information |Description=This map shows the shift in voting patterns from the 2004 U.S. presidential election and the 2008 U.S. presidential election. |S |
You cannot overwrite this file.
File usage on Commons
The following page uses this file:
File usage on other wikis
The following other wikis use this file:
- Usage on en.wikipedia.org
- Usage on id.wikipedia.org
- Usage on nl.wikipedia.org