File:U.S. Home Ownership and Subprime Origination Share.png

Original file (960 × 720 pixels, file size: 29 KB, MIME type: image/png)
Captions
Captions
Summary[edit]

|
This graph image could be re-created using vector graphics as an SVG file. This has several advantages; see Commons:Media for cleanup for more information. If an SVG form of this image is available, please upload it and afterwards replace this template with
{{vector version available|new image name}}.
It is recommended to name the SVG file “U.S. Home Ownership and Subprime Origination Share.svg”—then the template Vector version available (or Vva) does not need the new image name parameter. |
| Description |
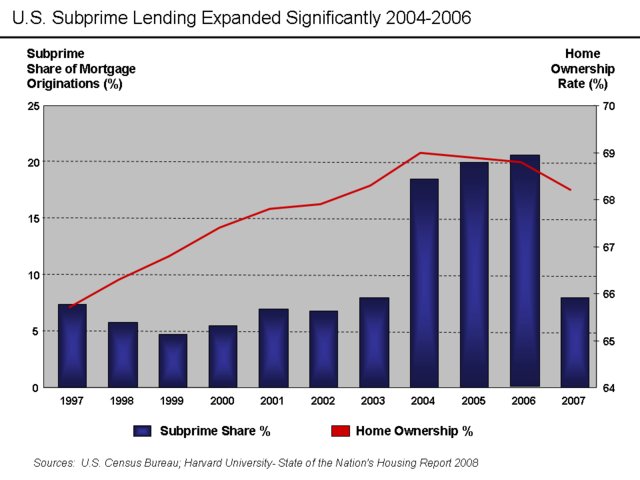
English: There are various mortgage categories defined based on the credit quality of the borrower. These include subprime, Alt-A, and Prime. The share of subprime mortgages is shown in the diagram. It is the ratio of the dollar value of subprime mortgages to all originations, expressed as a percentage. The level of home ownership is based on the percentage of American households that own homes rather than rent.
Subprime mortgages remained below 10% of all mortgage originations until 2004, when they spiked to nearly 20% and remained there through the 2005-2006 peak of the housing bubble.[1] A proximate event to this increase was the April 2004 decision by the SEC to relax the net capital rule, which encouraged the largest five investment banks to dramatically increase their financial leverage and aggressively expand their issuance of mortgage-backed securities. This applied additional competitive pressure to Fannie Mae and Freddie Mac, which further expanded their riskier lending.[2] Excerpts from the Harvard Report:
Other interpretations:
Source Data |
| Date | 30 May 2009 (original upload date) |
| Source | Transferred from en.wikipedia to Commons. |
| Author | Farcaster at English Wikipedia |
Licensing[edit]
- You are free:
- to share – to copy, distribute and transmit the work
- to remix – to adapt the work
- Under the following conditions:
- attribution – You must give appropriate credit, provide a link to the license, and indicate if changes were made. You may do so in any reasonable manner, but not in any way that suggests the licensor endorses you or your use.
- share alike – If you remix, transform, or build upon the material, you must distribute your contributions under the same or compatible license as the original.

|
Permission is granted to copy, distribute and/or modify this document under the terms of the GNU Free Documentation License, Version 1.2 or any later version published by the Free Software Foundation; with no Invariant Sections, no Front-Cover Texts, and no Back-Cover Texts. A copy of the license is included in the section entitled GNU Free Documentation License. |
Original upload log[edit]
- 2009-05-30 23:44 Farcaster 960×720× (30085 bytes)
- 2009-05-30 23:16 Farcaster 960×720× (28829 bytes) {{Information |Description = Subprime mortgage share as % originations and home ownership rate |Source = [http://www.jchs.harvard.edu/publications/markets/son2008/son2008.pdf Harvard 2008 State of Nation's Housing Report] |Date = M
File history
Click on a date/time to view the file as it appeared at that time.
| Date/Time | Thumbnail | Dimensions | User | Comment | |
|---|---|---|---|---|---|
| current | 00:57, 14 October 2010 | | 960 × 720 (29 KB) | Hideokun (talk | contribs) | {{Information |Description={{en|There are various mortgage categories defined based on the credit quality of the borrower. These include subprime, Alt-A, and Prime. The share of subprime mortgages is shown in the diagram. It is the ratio of the dollar va |
You cannot overwrite this file.
File usage on Commons
There are no pages that use this file.
File usage on other wikis
The following other wikis use this file:
- Usage on de.wikipedia.org
- Usage on el.wikipedia.org
- Usage on en.wikipedia.org
- Usage on fr.wikipedia.org
- Usage on gu.wikipedia.org
- Usage on hi.wikipedia.org
- Usage on hy.wikipedia.org
- Usage on it.wikipedia.org
- Usage on ja.wikipedia.org
- Usage on kn.wikipedia.org
- Usage on lt.wikipedia.org
- Usage on ta.wikipedia.org