File:Twilight illumination by sun altitude luxes 2 r 1.svg

Original file (SVG file, nominally 1,247 × 771 pixels, file size: 57 KB)
Captions
Captions
Summary[edit]
| Description |
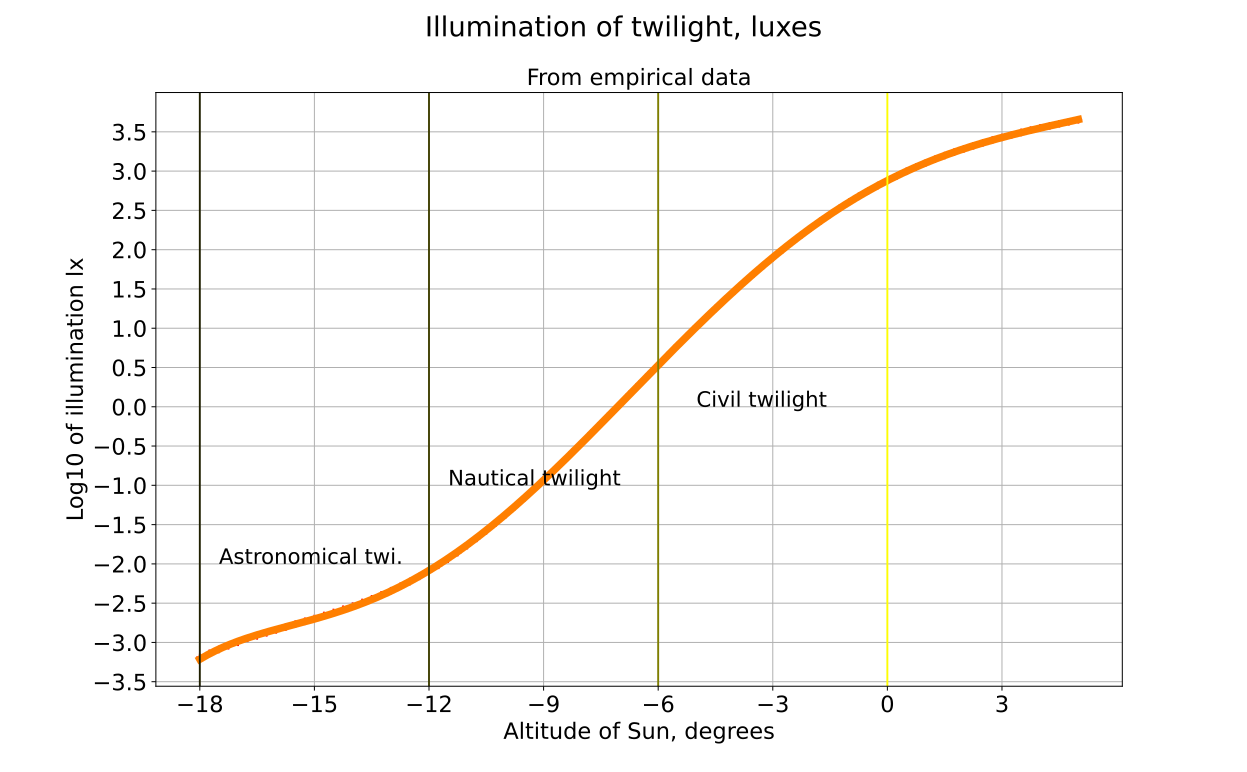
English: Illumination of twilight by sun altitude degrees |
| Date | |
| Source | Own work |
| Author | Merikanto |
Python source code
based on data from R "moonlit" package
https://github.com/msmielak/moonlit
Original source of data
-
- Twilight illumination from empirical data https://www.jstor.org/stable/44612241
- Sun Position and Twilight Times for Driver Visibility Assessment; Duane D.
- MacInnis, Peter B. Williamson and Geoffrey P. Nielsen; SAE Transactions;
- Vol. 104, Section 6: JOURNAL OF PASSENGER CARS: Part 1 (1995), pp. 759-783
- Values calulated from the paper for angles -18 to 5 degrees, by 0.25 degree, imported to R and spline function applied
Python3 polyfit code
- illumination of twilight
- python3 source code
- 19.8.2023 0000.0000
import math
import numpy as np
import matplotlib.pyplot as plt
- uses data from
- https://github.com/msmielak/moonlit
-
- Twilight illumination from empirical data https://www.jstor.org/stable/44612241
- Sun Position and Twilight Times for Driver Visibility Assessment; Duane D.
- MacInnis, Peter B. Williamson and Geoffrey P. Nielsen; SAE Transactions;
- Vol. 104, Section 6: JOURNAL OF PASSENGER CARS: Part 1 (1995), pp. 759-783
- Values calulated from the paper for angles -18 to 5 degrees, by 0.25 degree, imported to R and spline function applied
sun_altitudes0=np.array([5,4.75,4.5,4.25,4,3.75,3.5,3.25,3,2.75,2.5,2.25,2,1.75,1.5,1.25,1,0.75,0.5,0.25,0,-0.25,-0.5,-0.75,-1,-1.25,-1.5,-1.75,-2,-2.25,-2.5,-2.75,-3,-3.25,-3.5,-3.75,-4,-4.25,-4.5,-4.75,-5,-5.25,-5.5,-5.75,-6,-6.25,-6.5,-6.75,-7,-7.25,-7.5,-7.75,-8,-8.25,-8.5,-8.75,-9,-9.25,-9.5,-9.75,-10,-10.25,-10.5,-10.75,-11,-11.25,-11.5,-11.75,-12,-12.25,-12.5,-12.75,-13,-13.25,-13.5,-13.75,-14,-14.25,-14.5,-14.75,-15,-15.25,-15.5,-15.75,-16,-16.25,-16.5,-16.75,-17,-17.25,-17.5,-17.75,-18])
sun_illuminations0=np.array([4499.368645,4251.166227,4010.398231,3776.215801,3547.994929,3325.316934,3107.949504,2895.827638,2689.034018,2487.778469,2292.376367,2103.225979,1920.784922,1745.546056,1578.01326,1418.677674,1267.99505,1126.364901,994.1121318,871.4718063,758.577575,655.4541802,562.0142693,478.0595544,404.556034,338.5269901,281.0455199,231.5470057,189.3612856,153.7599131,123.995336,99.33178815,79.06826738,62.55436811,49.1999767,38.47993901,29.93480689,23.16869331,17.84514167,13.68176809,10.44428227,7.911259933,5.993606008,4.527348005,3.411591605,2.566090598,1.927671576,1.447053311,1.086102387,0.815522737,0.612949604,0.461403805,0.348056383,0.263253638,0.199755997,0.152149406,0.116393841,0.089479462,0.069166322,0.053788354,0.04210643,0.033198579,0.026378238,0.02113351,0.017082103,0.01393796,0.01148655,0.009566583,0.008056477,0.006931022,0.00596833,0.00519104,0.004556611,0.004033257,0.003596965,0.003229411,0.002916468,0.002647147,0.002412827,0.002206692,0.002023321,0.001858385,0.001708419,0.001570657,0.001442901,0.001323428,0.001210913,0.001104369,0.001003101,0.000906659,0.000814804,0.000727464,0.000644703])
sun_altitudes1=sun_altitudes0[::-1]
sun_illuminations1=sun_illuminations0[::-1]
log_sun_illuminations2=np.log10(sun_illuminations0[::-1])
fit1=np.polyfit(sun_altitudes1,log_sun_illuminations2,6)
poly1=np.poly1d(fit1)
altitudes2=np.linspace(-18,5,230)
- altitudes2=np.linspace(-18,90,900+180)
log_illums2=poly1(altitudes2)
- print(log_illums2)
fig = plt.figure()
ax = fig.gca()
ax.set_xticks(np.arange(-21, 6, 3))
ax.set_yticks(np.arange(-4, 4,0.5))
plt.xlabel("Altitude of Sun, degrees", size=18)
plt.ylabel("Log10 of illumination lx", size=18)
plt.yticks(fontsize=18)
plt.xticks(fontsize=18)
plt.suptitle("Illumination of twilight, luxes", fontsize=22)
plt.title("From empirical data", fontsize=18)
- plt.plot(alts1, logillums1, linewidth=6, color="#ff7f00")
- plt.plot(x2,y2,linewidth=6, color="#ff7f00" )
- plt.plot(altitude, log10_lux, linestyle=":", linewidth=4, color="#ffff00")
plt.plot(altitudes2, log_illums2,color="#ff7f00", linewidth=6 )
plt.scatter(sun_altitudes1, log_sun_illuminations2, marker='+', color="red")
plt.grid()
plt.axvline(x = 0, color = '#FFFF00', label = 'Sunset')
plt.axvline(x = -6, color = '#7f7f00', label = 'Civil twilight ends')
plt.axvline(x = -12, color = '#3f3f00', label = 'Nautical twilight ends')
plt.axvline(x = -18, color = '#1f1f00', label = 'Astronomical twilight ends')
plt.text(-5, 0, "Civil twilight", size=17)
plt.text(-11.5, -1, "Nautical twilight", size=17)
plt.text(-17.5, -2, "Astronomical twi.", size=17)
plt.show()
Licensing[edit]
- You are free:
- to share – to copy, distribute and transmit the work
- to remix – to adapt the work
- Under the following conditions:
- attribution – You must give appropriate credit, provide a link to the license, and indicate if changes were made. You may do so in any reasonable manner, but not in any way that suggests the licensor endorses you or your use.
- share alike – If you remix, transform, or build upon the material, you must distribute your contributions under the same or compatible license as the original.
File history
Click on a date/time to view the file as it appeared at that time.
| Date/Time | Thumbnail | Dimensions | User | Comment | |
|---|---|---|---|---|---|
| current | 12:20, 19 August 2023 | | 1,247 × 771 (57 KB) | Merikanto (talk | contribs) | Uploaded own work with UploadWizard |
You cannot overwrite this file.
File usage on Commons
There are no pages that use this file.