File:Tulilahti Finland illumination night 27 28 07 1959 1.svg

Original file (SVG file, nominally 630 × 630 pixels, file size: 132 KB)
Captions
Captions
Summary[edit]
| DescriptionTulilahti Finland illumination night 27 28 07 1959 1.svg |
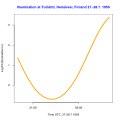
English: Illumination at Tulilahti, Finland. Double murder site, approximated murder and caching time. Night 27-20 July 1959, was clear and not very dark, minimum illumination was nautical twilight. |
| Date | |
| Source | Own work |
| Author | Merikanto |
"R" code with plot and "moonlit" package
-
- illumination at Tulilahti, Heinävesi, Finland
- famous double murder site and time, night 27-18.1959
- times UTC, not local time
- "R" code
- uses "moonlit" package
- 13.8.2023 0000.0002
- install and load devtools
- install.packages("devtools")
- library(devtools)
- install moonlit library from github repo
- install_github("msmielak/moonlit")
- load the moonlit library
library(moonlit)
library(suncalc)
library(ggplot2)
library(lubridate)
- heinävesi tulilahden murha
paikka1="Tulilahti, Heinävesi"
lon1=28.630556
lat1=62.426389
date1="1959-07-27"
date2="1959-07-28"
datetime1="1959-07-27 21:59:59"
timezone1="UTC"
- timezone1="Europe/Helsinki"
e1=0.26
t1="1 mins"
- "1959-7-27 20:00"
- "1959-7-28 2:00"
datetimes2<-seq(as.POSIXct("1959-7-27 18:00", tz = "UTC"),
as.POSIXct("1959-7-28 2:00", tz = "UTC"), by = "min")
- print(datetimes2)
- stop(-1)
- print("Sun " )
sunpos1<-getSunlightPosition(date = as.POSIXct(datetimes2, tz = "UTC"),
lat = lat1, lon = lon1)
- print("Moon " )
moonpos1<-getMoonPosition(date = as.POSIXct(datetimes2, tz = "UTC"),
lat = lat1, lon = lon1)
moonillum1<-getMoonIllumination(date = c(datetimes2),
keep = c("fraction", "phase"))
- phase 0.25 asc half moon crescent 0.5 full moon 0.75 last qarter
sunset01<-getSunlightTimes(date = as.Date(date1, tz = "UTC"),
lat = lat1, lon = lon1, keep=c("sunset"))
sunset1=as.POSIXct( sunset01['sunset']$sunset, tz = "EET")


sunrise01<-getSunlightTimes(date = as.Date(date2, tz = "UTC"),
lat = lat1, lon = lon1, keep=c("sunrise"))
sunrise1=as.POSIXct( sunrise01['sunrise']$sunrise, tz = "EET")
print(sunset1)
print(sunrise1)
- stop(-1)
salt1= sunpos1[4]$altitude
saz1= sunpos1[4]$azimuth1
- print(salt1)
salt2=180*salt1/3.1416


saz2=(360*salt1)/3.1416


malt1= moonpos1[4]$altitude
maz1= moonpos1[4]$azimuth1
- print(malt1)
malt2=180*malt1/3.1416


maz2=(360*malt1)/3.1416+360


print("Sun")
- print(sunpos1)
- print("Moon")
- print(moonpos1)
date1=as.POSIXct(datetimes2, tz=timezone1)
intensity1<-calculateMoonlightIntensity(lat1, lon1, datetimes2, e1)
- calculateMoonlightStatistics(lat, lon, date, e, t, timezone)
- print(intensity1)
- print(paikka1)
- print(c(datetimes2, " UTC") )
- print("Auringon korkeus, suuntakulma astetta")
- print(salt2)
- print(saz2)
- print("Kuun korkeus, suuntakulma astetta")
- print(malt2)
- print(maz2)
- print("Kuun valaistu osa ")
- print( moonillum1[2]$fraction )
- print("Kuun vaihe ")
- print( moonillum1[3]$phase )
- print ( "Valaistus lx" )
- print(intensity1['illumination']$illumination)
- print (" Josta kuunvaloa lx")
- print(intensity1['moonlightModel']$moonlightModel)
svg("tulilahti_Finland_illumination_night_27_28_07_1979_1.svg")
- plot(datetimes2,log10(intensity1['illumination']$illumination),
- col='orange', type='l', lwd=5,
- main="Illumination at Tulilahti, Heinävesi, Finland 27.-28.7. 1959",
- col.main='blue',
- xlab="Time UTC, 27-28.7 1959",
- ylab="Log10 (illumination lx)")
print("KKKK")
- datee <- hour(hm( datetimes2))
- datee <-hour(datetimes2)
datee0<-datetimes2
datee1<-format(datee0, tz="EET",usetz=TRUE)
datee<-as.POSIXct( datee1, tz = "EET")


log10lx<-log10(intensity1['illumination']$illumination)
- print("pppp")
data2 <- data.frame(datee,log10lx)
- print("qqq")
names(data2)<-c("Time_EET", "Illum_log_Lx")


print("rrr")
- stop(-1)
- Plot
ggplot(data2, aes(x=Time_EET, y=Illum_log_Lx)) +
geom_line( color="#ff7f00", linewidth=1.5, alpha=0.9, linetype=1) +
ggtitle(label=" Illumination of Sun, night 27.-28.7.1959", subtitle="Tulilahti, Heinävesi, Savo, Finland ")+
 xlab("Time EET") + ylab("Max illumination, log10 of Lx")+
 scale_x_datetime(date_breaks = "1 hours", date_labels = "%H:%M")+
 theme_bw() +
 geom_hline(yintercept=log10(300), linetype="dashed", color = "red")+
 geom_hline(yintercept=log10(3.5), linetype="dashed", color = "red")+

  geom_hline(yintercept=log10(0.1), linetype="dashed", color = "blue") +

  annotate(geom="text", x=sunset1, y=log10(300), label="Sunset", color="black", size=6)+
  annotate(geom="text", x=sunrise1, y=log10(300), label="Sunrise", color="black", size=6)+
  annotate(geom="text", x=as.POSIXct("1959-7-27 22:00", tz = "EET"), y=log10(0.1), label="Full moon if it was", color="black", size=6)+
  annotate(geom="text", x=as.POSIXct("1959-7-27 22:00", tz = "EET"), y=log10(3.5), label="Limit of civil/nautical twilight ", color="black", size=6)+
  annotate(geom="text", x=as.POSIXct("1959-7-28 00:00", tz = "EET"), y=log10(30), label="Civil twilight ", color="blue", size=8)+
  annotate(geom="text", x=as.POSIXct("1959-7-28 00:00", tz = "EET"), y=log10(1), label="Nau. twi.", color="#00007f", size=8)+
  theme(text = element_text(size = 19, family="Sans") )+
theme(axis.text = element_text(size = 16)) +
theme(axis.title = element_text(size = 17)) +
theme(plot.title = element_text(size = 15, face = "bold"))
dev.off()
- statistics1<-calculateMoonlightStatistics(lat1, lon1, datetime1, e1, t1, timezone1)
- print(statistics1)
Licensing[edit]
- You are free:
- to share – to copy, distribute and transmit the work
- to remix – to adapt the work
- Under the following conditions:
- attribution – You must give appropriate credit, provide a link to the license, and indicate if changes were made. You may do so in any reasonable manner, but not in any way that suggests the licensor endorses you or your use.
- share alike – If you remix, transform, or build upon the material, you must distribute your contributions under the same or compatible license as the original.
File history
Click on a date/time to view the file as it appeared at that time.
| Date/Time | Thumbnail | Dimensions | User | Comment | |
|---|---|---|---|---|---|
| current | 16:22, 13 August 2023 |  | 630 × 630 (132 KB) | Merikanto (talk | contribs) | Update |
| 15:22, 13 August 2023 |  | 630 × 630 (127 KB) | Merikanto (talk | contribs) | Update | |
| 13:25, 13 August 2023 |  | 630 × 630 (71 KB) | Merikanto (talk | contribs) | Uploaded own work with UploadWizard |
You cannot overwrite this file.
File usage on Commons
There are no pages that use this file.
Metadata
This file contains additional information such as Exif metadata which may have been added by the digital camera, scanner, or software program used to create or digitize it. If the file has been modified from its original state, some details such as the timestamp may not fully reflect those of the original file. The timestamp is only as accurate as the clock in the camera, and it may be completely wrong.
| Width | 504pt |
|---|---|
| Height | 504pt |