File:Swineflu uk rate.svg

Original file (SVG file, nominally 637 × 475 pixels, file size: 89 KB)
Captions
Captions
Summary[edit]
| Description |
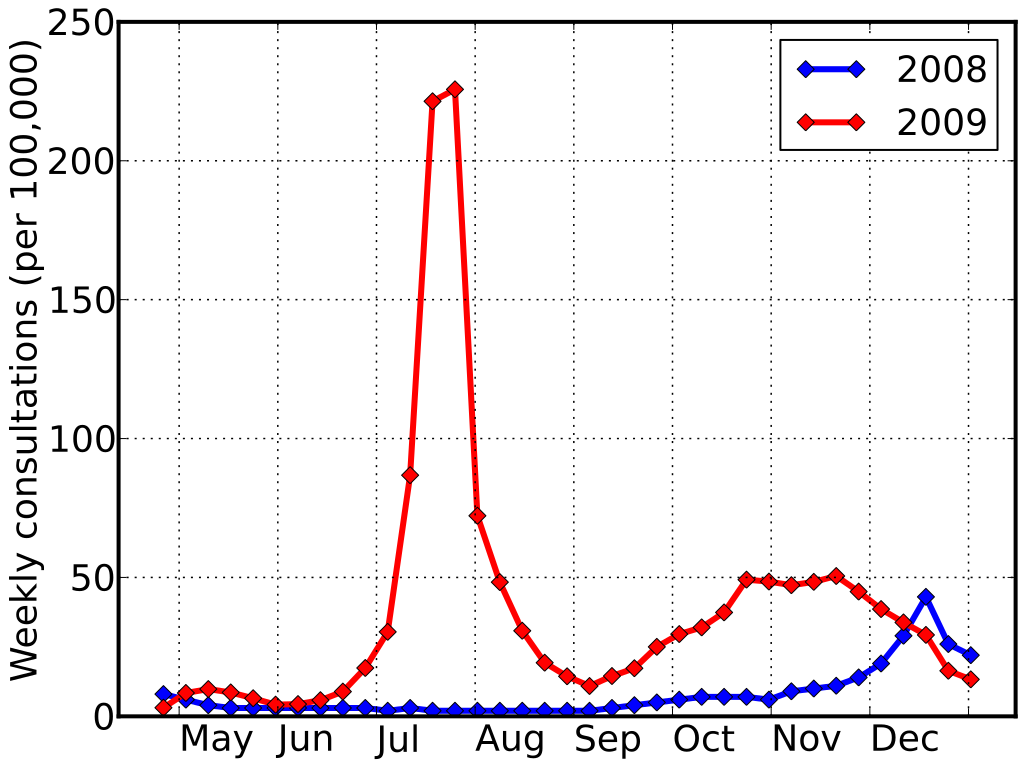
English: Weekly consultation rate for influenza-like illness in the UK |
| Date | |
| Source | Graph is own work by uploader, numerical data from documents at HPA which sourced data from QResearch. |
| Author | Dave Farrance |
Source[edit]
Figures for 2009 flu sourced from documents at HPA Weekly epidemiological updates archive [1] archive copy at the Wayback Machine and figures for 2008 flu estimated from inspection of Fig 2 at web-page for HPA's Weekly pandemic flu update for 16th July 2009 [2].
This graph was created with the following Python/Matplotlib script:
#!/usr/bin/env python
from pylab import *
flu08=[8, 6, 4, 3, 3, 3, 3, 3, 3, 3, 2, 3, 2, 2, 2, 2, 2, 2, 2, 2,
  3, 4, 5, 6, 7, 7, 7, 6, 9, 10, 11, 14, 19, 29, 43, 26, 22]
flu09=[3.1, 8.4, 9.8, 8.6, 6.5, 4.2, 4.4, 5.8, 8.9, 17.4, 30.4, 86.8, 221.4,
  225.7, 72.2, 48.3, 30.8, 19.3, 14.4, 10.9, 14.5, 17.3, 25.0, 29.6, 32.0,
  37.4, 49.2, 48.5, 47.2, 48.4, 50.5, 44.9, 38.6, 33.8, 29.3, 16.4, 13.3]
rc('axes',lw=2.0)
plot(range(17,17+len(flu08)), flu08, 'bD-', lw=3.0, label='2008')
plot(range(17,17+len(flu09)), flu09, 'rD-', lw=3.0, label='2009')
xticks( array(range(0,9))*4.4+17.7,
  ['May','Jun','Jul','Aug','Sep','Oct','Nov','Dec'],size=18,ha='left')
yticks(size=18)
grid(lw=0.75)
ylabel('Weekly consultations (per 100,000)',size=18)
rc('legend',fontsize=18); legend()
savefig('sf-qs.svg')
Licensing[edit]
I release the graph and its source script to the public domain -- but note that the numerical data that was used to create this graph was sourced from press release documents on the HPA website, which sourced data from QResearch, but I could find no statement of rights to that numerical data either in the documents or on the website.
| I, the copyright holder of this work, release this work into the public domain. This applies worldwide. In some countries this may not be legally possible; if so: I grant anyone the right to use this work for any purpose, without any conditions, unless such conditions are required by law. |
File history
Click on a date/time to view the file as it appeared at that time.
| Date/Time | Thumbnail | Dimensions | User | Comment | |
|---|---|---|---|---|---|
| current | 14:42, 15 January 2010 | | 637 × 475 (89 KB) | Farry (talk | contribs) | update 2010-01-15 |
| 22:51, 25 December 2009 |  | 646 × 483 (94 KB) | Farry (talk | contribs) | update 2009-12-24 | |
| 20:56, 18 December 2009 |  | 642 × 483 (93 KB) | Farry (talk | contribs) | update 2009-12-17 | |
| 18:14, 10 December 2009 |  | 644 × 480 (93 KB) | Farry (talk | contribs) | update 2009-12-10 | |
| 21:58, 3 December 2009 |  | 637 × 475 (93 KB) | Farry (talk | contribs) | update 2009-12-03 | |
| 21:08, 26 November 2009 |  | 644 × 478 (89 KB) | Farry (talk | contribs) | fix glitch in date axis | |
| 21:01, 26 November 2009 |  | 644 × 478 (52 KB) | Farry (talk | contribs) | update 2009-11-26 | |
| 19:36, 20 November 2009 |  | 627 × 467 (84 KB) | Farry (talk | contribs) | Update 2009-11-20 | |
| 22:25, 12 November 2009 |  | 627 × 467 (84 KB) | Farry (talk | contribs) | Update 2009-11-12 | |
| 21:10, 6 November 2009 |  | 627 × 467 (83 KB) | Farry (talk | contribs) | Update 2009-11-05 |
You cannot overwrite this file.
File usage on Commons
There are no pages that use this file.
File usage on other wikis
The following other wikis use this file:
- Usage on en.wikipedia.org