File:Swastika curve.svg
Jump to navigation
Jump to search

Size of this PNG preview of this SVG file: 512 × 512 pixels. Other resolutions: 240 × 240 pixels | 480 × 480 pixels | 768 × 768 pixels | 1,024 × 1,024 pixels | 2,048 × 2,048 pixels.
Original file (SVG file, nominally 512 × 512 pixels, file size: 2 KB)
Captions
Captions
Add a one-line explanation of what this file represents
Summary[edit]
| Description |
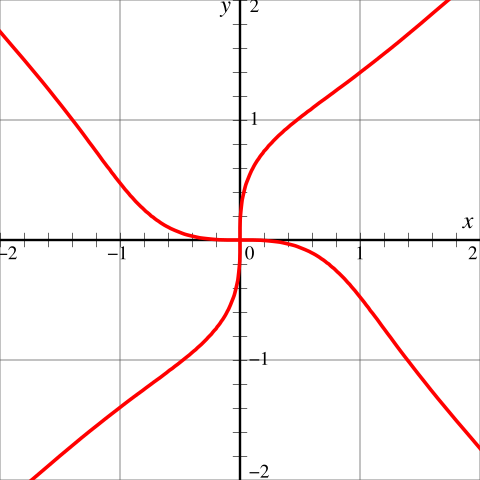
English: The Swastika curve plotted using 79 data points in first quadrant and repeated using symmetry. |
| Date | |
| Source | Own work |
| Author | Krishnavedala |
| Other versions | Image:Swastica_curve3.png |
| SVG development | This vector image was created with a text editor. |
Source Code[edit]
#include <stdio.h>
#include <stdlib.h>
#include <math.h>
#include <unistd.h>
#include <plplot/plplot.h>
long unsigned int NUM_PTS = 10000;
PLINT XMAX = 2;
PLINT YMAX = 2;
void generateCurve(PLFLT *x, PLFLT *y)
{
int i = 0;
double r, theta=0.f;
float step = 2*PI/NUM_PTS;
float s, c;
while(theta < 2*PI)
{
s = sin(theta); c = cos(theta);
r = sqrt(s * c / (pow(s,4) - pow(c,4)));
x[i] = (PLFLT) (r * cos(theta));
y[i] = (PLFLT) (r * sin(theta));
/*
x[i] = (PLFLT) cos(theta) * sqrt(-1/sin(theta*4)) * modulus(sin(2*theta));
y[i] = (PLFLT) sin(theta) * sqrt(-1/sin(theta*4)) * modulus(sin(2*theta));
*/
theta += (double) step;
i++;
}
}
int main(void)
{
PLFLT *X = NULL, *Y = NULL;
plscolbg(255, 255, 255);
plsdev("wxwidget");
plinit(); // initialize plotting library
plscol0(15, 0, 0, 0);
plcol(15);
plenv(-XMAX, XMAX, -YMAX, YMAX, 1, -2);
plbox( "abcstn", 0, 0, "anbcst", 0, 0);
pllab("X", "Y", "Swastika Curve");
X = (PLFLT*) malloc(NUM_PTS * sizeof(PLFLT*));
Y = (PLFLT*) malloc(NUM_PTS * sizeof(PLFLT*));
if(X == NULL || Y == NULL)
{
perror("Unable to allocate memory!!");
free(X); free(Y); exit(1);
}
generateCurve(X, Y);
plline(NUM_PTS, X, Y);
plend(); // close the plotting library
{ free(X); free(Y); }
return 0;
}
Licensing[edit]
I, the copyright holder of this work, hereby publish it under the following licenses:
This file is licensed under the Creative Commons Attribution-Share Alike 3.0 Unported license.
- You are free:
- to share – to copy, distribute and transmit the work
- to remix – to adapt the work
- Under the following conditions:
- attribution – You must give appropriate credit, provide a link to the license, and indicate if changes were made. You may do so in any reasonable manner, but not in any way that suggests the licensor endorses you or your use.
- share alike – If you remix, transform, or build upon the material, you must distribute your contributions under the same or compatible license as the original.

|
Permission is granted to copy, distribute and/or modify this document under the terms of the GNU Free Documentation License, Version 1.2 or any later version published by the Free Software Foundation; with no Invariant Sections, no Front-Cover Texts, and no Back-Cover Texts. A copy of the license is included in the section entitled GNU Free Documentation License. |
You may select the license of your choice.
File history
Click on a date/time to view the file as it appeared at that time.
| Date/Time | Thumbnail | Dimensions | User | Comment | |
|---|---|---|---|---|---|
| current | 18:25, 19 April 2015 | | 512 × 512 (2 KB) | Krishnavedala (talk | contribs) | simplified drawing |
| 15:01, 24 November 2010 |  | 645 × 645 (86 KB) | AnonMoos (talk | contribs) | cosmetic changes to be more suitable for use in articles. | |
| 13:53, 24 November 2010 |  | 900 × 675 (104 KB) | Krishnavedala (talk | contribs) | Changed the plot color to black. == Source Code == #include <stdio.h> #include <stdlib.h> #include <math.h> #include <unistd.h> #include <plplot/plplot.h> long unsigned int NUM_PTS = 10000; PLINT XMAX = 2; PLINT YMAX = 2; void generateCu | |
| 13:33, 24 November 2010 |  | 900 × 675 (104 KB) | Krishnavedala (talk | contribs) | {{Information |Description={{en|1=The Swastika curve plotted and saved using PLplot library.}} |Source={{own}} |Author=Krishnavedala |Date=2010-11-24 |Permission= |other_versions=[[:Image:Sw |
You cannot overwrite this file.
File usage on Commons
The following 2 pages use this file:
File usage on other wikis
The following other wikis use this file:
- Usage on es.wikipedia.org
- Usage on hi.wikipedia.org
- Usage on nl.wikipedia.org
- Usage on ru.wikipedia.org
- Usage on ta.wikipedia.org
- Usage on www.wikidata.org
- Usage on zh.wikipedia.org