File:Spectre visible lineaire en longueur d onde.png
Original file (1,665 × 395 pixels, file size: 26 KB, MIME type: image/png)
Captions
Captions
Summary[edit]
| Description |
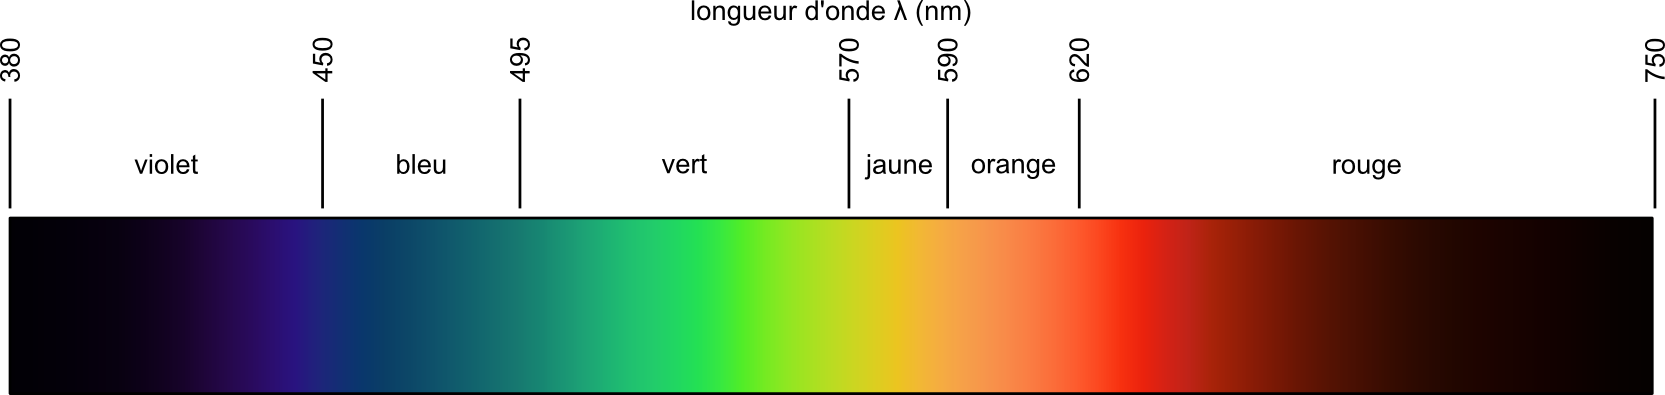
English: A linear representation of the visible light spectrum, French caption.
Français : Une représentation libéaire en longueur d'onde du spectre lumineux visible. Les gammes de couleurs sont issues du CRC Handbook of Fundamental Spectroscopic Correlation Charts (voir w:Visible spectrum). Les coordonnées spectrales XYZ sont tirées du CIE.
Tous les 10 nm, le point spectral est utilisé pour rechercher la couleur sRGB correspondante (en considérant la condition de visualisation "Dim", tamisé). La recherche se fait par une recherche binaire le long d'une ligne dans l'espace TSL entre le point spectral, et un point avec une luminosité de 0.3 * luminosité (L), une teinte 0 (T), et la même saturation (S) que le point spectral. La recherche se termine lorsque le point se trouvve dans l'espace sRGB. La matrice CAT02 a été modifiée comme suggéré dans Brill(2008) pour réduire le problème jaune-bleu en remplaçant la ligne du bas (0.0030, 0.0136, 0.9834) par (0,0,1). Un lissage itératif a été appliqué pour gommer les grands sauts de teinte (changements supérieurs à 5 %). Le code utilisé pour générer le gradient de couleurs peut être trouvé ici.Esperanto: Koloroj videblaj
Nederlands: Kleurenspectrum
中文(简体):软件模拟的可见光谱。
中文(繁體):軟件模擬的可見光譜。 |
| Date | (UTC) |
| Source |
This file was derived from: Linear visible spectrum.svg: |
| Author |
|
| This is a retouched picture, which means that it has been digitally altered from its original version. Modifications: caption in French; +x-axis label. The original can be viewed here: Linear visible spectrum.svg:
|
Licensing[edit]
| I, the copyright holder of this work, release this work into the public domain. This applies worldwide. In some countries this may not be legally possible; if so: I grant anyone the right to use this work for any purpose, without any conditions, unless such conditions are required by law. |
Original upload log[edit]
This image is a derivative work of the following images:
- File:Linear_visible_spectrum.svg licensed with PD-self
- 2010-08-05T05:28:26Z Gringer 605x115 (17964 Bytes) 10-step iterative chroma smoothing, slightly brighter grey point
- 2010-08-04T15:34:49Z Gringer 605x115 (17964 Bytes) Smoothing applied to largest reduction in saturation (blue to cyan)
- 2010-08-04T14:40:43Z Gringer 605x115 (18828 Bytes) Only using one adaptation matrix, finer resolution at blue clip point
- 2010-08-03T13:12:09Z Gringer 605x115 (18828 Bytes) using Chroma-based cartesian coordinates for search
- 2010-08-03T12:44:16Z Gringer 605x115 (18828 Bytes) Modified MH matrix slightly based on [http://www3.interscience.wiley.com/journal/112396194/abstract this]
- 2010-08-03T11:51:18Z Gringer 605x115 (18828 Bytes) whoops, that was an older version
- 2010-08-03T11:43:39Z Gringer 605x115 (13629 Bytes) slightly different MCAT02 matrix, different binary search algorithm
- 2010-07-31T16:06:13Z Gringer 605x115 (17964 Bytes) using CIECAM02 model
- 2010-07-29T11:00:29Z Gringer 605x115 (17964 Bytes) adjusting intensity between linear sRGB and non-linear sRGB, as gamma correction is encoded into that transform.
- 2010-07-29T08:51:03Z Gringer 605x115 (17965 Bytes) Trying a gamma correction of 2.2 (e.g. x^(1/2.2)), rather than square root function
- 2010-07-28T11:35:33Z Gringer 605x115 (17964 Bytes) generated RGB equivalent spectrum using sRGB matrix transform + spectrum->XY lookup tables.
- 2008-11-17T04:40:12Z Gringer 605x115 (13629 Bytes) Added cyan band again, reduced luminosity to try to fit colour with [[:Image:NASA_Hydrogen_spectrum.jpg]].
- 2008-08-31T01:53:18Z Gringer 605x115 (13488 Bytes) Updated using "Electric violet" colour @ 400nm, Luminosity reduced to remove Mach bands
- 2008-08-30T02:18:35Z Gringer 605x115 (13487 Bytes) Attempt assuming monitor RGB are the same as monochromatic wavelengths from http://www.cis.rit.edu/mcsl/research/broadbent/CIE1931_RGB.xls, used wavelengths from there for transition points (except for violet, which was left
- 2008-08-29T11:59:06Z Gringer 605x115 (13503 Bytes) Attempt using RGB colours from http://hyperphysics.phy-astr.gsu.edu/hbase/vision/cie.html#c4
- 2008-08-29T04:01:38Z Gringer 605x115 (13614 Bytes) Added cyan point at 495nm, reduced luminosity of most colours in an attempt to remove [[w:Mach bands]]
- 2008-08-28T04:47:24Z Gringer 605x115 (13488 Bytes) Changed violet RGB representation to "colour wheel violet"
- 2008-08-28T04:30:23Z Gringer 605x115 (13488 Bytes) Forgot to re-align wavelength bands to start of rectangle
- 2008-08-28T04:25:36Z Gringer 605x115 (13488 Bytes) Reverted to old colours (with metadata), added wavelengths at transition points (to make more like [[:Image:Logarithmic visible spectrum.svg]]
- 2008-08-28T03:01:06Z Gringer 600x70 (1989 Bytes) Removed metadata in SVG to reduce file size.
- 2008-08-28T02:52:18Z Gringer 600x70 (5007 Bytes) Reduced luminosity for colours to make transition less jarring [[Category:spectrum]]
- 2008-08-27T05:10:29Z Gringer 600x70 (5001 Bytes) {{Information |Description={{en|1=A linear representation of the visible light spectrum. Colour ranges were taken from 'CRC Handbook of Fundamental Spectroscopic Correlation Charts.' (see [[w:Visible spectrum]]) Except for vi
Uploaded with derivativeFX
File history
Click on a date/time to view the file as it appeared at that time.
| Date/Time | Thumbnail | Dimensions | User | Comment | |
|---|---|---|---|---|---|
| current | 09:00, 12 March 2014 | 1,665 × 395 (26 KB) | Cdang (talk | contribs) | == {{int:filedesc}} == {{Information |Description={{en|1=A linear representation of the visible light spectrum. Colour ranges were taken from 'CRC Handbook of Fundamental Spectroscopic Correlation Charts' (see w:Visible spectrum). Spectral XYZ locu... |
You cannot overwrite this file.
File usage on Commons
There are no pages that use this file.