File:Shale gas production USA.svg
Jump to navigation
Jump to search

Size of this PNG preview of this SVG file: 800 × 417 pixels. Other resolutions: 320 × 167 pixels | 640 × 334 pixels | 1,024 × 534 pixels | 1,280 × 668 pixels | 2,560 × 1,336 pixels.
Original file (SVG file, nominally 1,150 × 600 pixels, file size: 78 KB)
Captions
Captions
Add a one-line explanation of what this file represents
Summary[edit]
| Description |
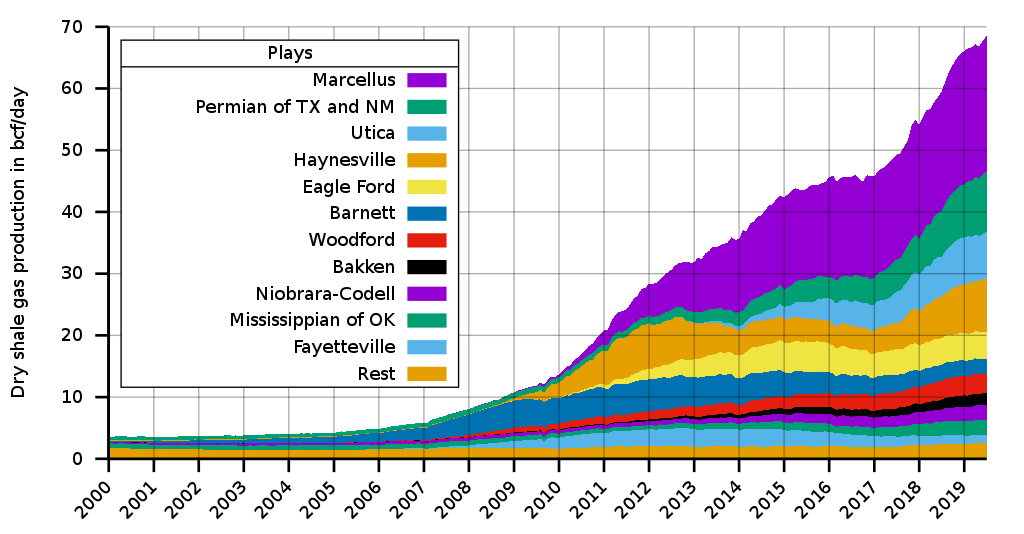
English: Natural gas production from US shale plays as estimated by the U.S. Energy Information Administration (EIA) |
| Date | (creation date of original version) |
| Source |
Own work Data source: excel sheet from EIA (as of July 2019), retrieved via EIA Natural Gas Weekly Update Data source of original version is available at archive.org |
| Author |
Original version: Kopiersperre Updated version as of July 2019: Gretarsson |
| SVG development | This plot uses embedded text that can be easily translated using a text editor. |
| Source code | Gnuplot codereset
set terminal svg size 1150,600 font "DejaVu Sans,20"
set key top left box lw 1.5 samplen 2 title 'Plays'
set border 3 linewidth 3
set grid lt 1 lw 1.5 lc rgb 0xAA090909 front
set xdata time
set timefmt '%Y-%m-%d'
set format x '%Y'
set ylabel 'Dry shale gas production in bcf/day'
set tics nomirror out
set xtics 60*60*24*365.25 rotate by 45 right
unset mxtics
set autoscale xfix
set yrange [0:]
set datafile separator ";"
set output 'Shale gas production USA.svg'
plot \
for [i=2:13] \
'data.csv' using 1:(sum [col=i:13] column(col)) \
title columnheader(i) \
with filledcurves x1
unset output
|
Licensing[edit]
I, the copyright holder of this work, hereby publish it under the following license:
This file is licensed under the Creative Commons Attribution-Share Alike 4.0 International license.
- You are free:
- to share – to copy, distribute and transmit the work
- to remix – to adapt the work
- Under the following conditions:
- attribution – You must give appropriate credit, provide a link to the license, and indicate if changes were made. You may do so in any reasonable manner, but not in any way that suggests the licensor endorses you or your use.
- share alike – If you remix, transform, or build upon the material, you must distribute your contributions under the same or compatible license as the original.
File history
Click on a date/time to view the file as it appeared at that time.
| Date/Time | Thumbnail | Dimensions | User | Comment | |
|---|---|---|---|---|---|
| current | 20:27, 24 September 2019 | | 1,150 × 600 (78 KB) | Gretarsson (talk | contribs) | "Declared character encoding" altered to UTF-8 in order to make file valid again according to W3C markup validation |
| 15:45, 20 August 2019 |  | 1,150 × 600 (78 KB) | Gretarsson (talk | contribs) | It’s probably better to consequently use the same play names as in the source data. I have researched which formations could be included in ‘Permian (TX, NM)’ and ‘Mississippian (OK)’ but I’m not sure whether this is the Wolfcamp Shale and the Caney, Springer, and Goddard Fms, respectively. A play map of the EIA (https://www.eia.gov/maps/images/shale_gas_lower48.jpg) cites only the Abo, Yeso, Bone Springs, and Spraberry Fms for the Permian Basin (even though there is mention of shale gas prod... | |
| 23:41, 19 August 2019 |  | 1,150 × 600 (78 KB) | Gretarsson (talk | contribs) | closer in style to the original one | |
| 23:11, 19 August 2019 |  | 1,150 × 600 (78 KB) | Gretarsson (talk | contribs) | updated as per July 2019 | |
| 09:55, 18 October 2016 |  | 1,000 × 600 (90 KB) | Kopiersperre (talk | contribs) | fontsize | |
| 09:52, 18 October 2016 |  | 1,000 × 600 (90 KB) | Kopiersperre (talk | contribs) | =={{int:filedesc}}== {{Information |description={{en|1=Natural gas production from US shale plays}} |Date={{subst:CURRENTYEAR}}-{{subst:CURRENTMONTH}}-{{subst:CURRENTDAY2}} |source={{own}}<br />[http://www.eia.gov/naturalgas/weekly/img/shale_gas_201608... |
You cannot overwrite this file.
File usage on Commons
The following page uses this file:
File usage on other wikis
The following other wikis use this file:
- Usage on ar.wikipedia.org
- Usage on de.wikipedia.org
- Usage on en.wikipedia.org
- Usage on zh.wikipedia.org