File:Schematic representation of the effect of bottlenecks on genetic diversity.PNG
Jump to navigation
Jump to search

Size of this preview: 730 × 600 pixels. Other resolutions: 292 × 240 pixels | 585 × 480 pixels | 935 × 768 pixels | 1,247 × 1,024 pixels | 2,494 × 2,048 pixels | 4,325 × 3,552 pixels.
Original file (4,325 × 3,552 pixels, file size: 1.36 MB, MIME type: image/png)
Captions
Captions
Add a one-line explanation of what this file represents
| Description |
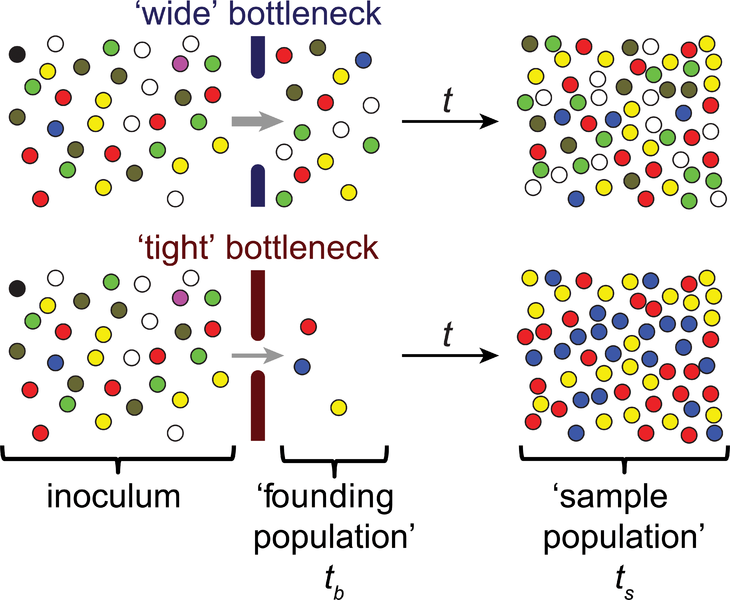
English: Schematic representation of the effect of bottlenecks on genetic diversity.
Individual pathogens are shown as colored spheres; the colors represent distinguishable markers. The barriers to infection that constitute the bottleneck are shown by the solid bars and the size of the bottleneck is represented by the size of the gap between these bars. Bottlenecks are events that dramatically reduce the original population size, for example, the inoculum in infectious diseases. In the context of infection, the founding population consists of the pathogens that survive passage through the bottleneck and give rise to a population in a new environment, e.g., a new host or anatomical site. Often it is not feasible to sample directly after the bottleneck event (tb); instead, populations are sampled (at time ts) after the passage of time (t), represented by the black arrow. During this time, the founding population often replicates. Wide bottlenecks lead to limited loss of markers (e.g., the magenta and black spheres) and limited changes in the marker frequencies (e.g., over-representation of the blue and under-representation of the olive marker). In contrast, tight bottlenecks lead to stochastic loss of many markers and substantial changes in marker frequencies. These changes can be used to determine the magnitude of bottleneck events and the size of the founding population, even after the population size has increased, provided that the expansion has limited effect on the marker composition (i.e., markers are fitness neutral, and no additional genetic drift occurs). |
| Date | Published: June 11, 2015 |
| Source | Abel S, Abel zur Wiesch P, Davis BM, Waldor MK (2015) Analysis of Bottlenecks in Experimental Models of Infection. PLoS Pathog 11(6): e1004823. doi:10.1371/journal.ppat.1004823 http://journals.plos.org/plospathogens/article?id=10.1371/journal.ppat.1004823 |
| Author | Sören Abel , Pia Abel zur Wiesch, Brigid M. Davis, Matthew K. Waldor |
|
This file is licensed under the Creative Commons Attribution 2.5 Generic license.
|
This file was published in a Public Library of Science journal. Their website states that the content of all PLOS journals is published under the Creative Commons Attribution 4.0 license (or its previous version depending on the publication date), unless indicated otherwise.
|
File history
Click on a date/time to view the file as it appeared at that time.
| Date/Time | Thumbnail | Dimensions | User | Comment | |
|---|---|---|---|---|---|
| current | 10:24, 24 September 2016 | | 4,325 × 3,552 (1.36 MB) | Was a bee (talk | contribs) | {{Information |Description={{en|1=Schematic representation of the effect of bottlenecks on genetic diversity. Individual pathogens are shown as colored spheres; the colors represent distinguishable markers. The barriers to infection that constitute the... |
You cannot overwrite this file.
File usage on Commons
There are no pages that use this file.