File:S change 1991 2005.GIF
From Wikimedia Commons, the free media repository
Jump to navigation
Jump to search

Size of this preview: 661 × 599 pixels. Other resolutions: 265 × 240 pixels | 529 × 480 pixels | 847 × 768 pixels | 1,213 × 1,100 pixels.
Original file (1,213 × 1,100 pixels, file size: 63 KB, MIME type: image/gif)
File information
Structured data
Captions
Captions
Add a one-line explanation of what this file represents
Summary[edit]
| DescriptionS change 1991 2005.GIF |
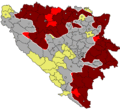
English: Population change in BiH Serb population by municipalities in period 1991-2005. Yellow are municipalities in which Serbs had less than 10% in census of 1991, dark red are municipalities in which theirs percentage has grown by more than 5 percent by the year 2005, grey are municipaties in which their percentage has fallen by more than 5% in 2005, and light red are municipalities in which there was no such change (less then 5 percent change). Deutsch: Die Veränderung der Bevölkerungszahl der n in den Gemeinden von Bosnien und Herzegowina von 1991-2005. Gelb sind die Gemeinden, in denen die Anzahl der Serben weniger als 10% von 1991 ist. Dunkelrot sind die Gemeinden, in denen der Anteil der Serben sich um mehr als 5 Prozent bis zum Jahr 2005 gestiegen ist. Grau sind die Gemeinden, in denen der Prosentsatz der Serben um mehr als 5% im Jahr 2005 gefallen ist und hellrot sind die Gemeinden, in denen der Anteil der Serben weniger als 5 Prozent gesunken ist. |
| Date | |
| Source | Own work |
| Author | Electionworld |
Licensing[edit]
| Public domainPublic domainfalsefalse |
| I, the copyright holder of this work, release this work into the public domain. This applies worldwide. In some countries this may not be legally possible; if so: I grant anyone the right to use this work for any purpose, without any conditions, unless such conditions are required by law. |
source is [1], map was created by me using the informations from that source
File history
Click on a date/time to view the file as it appeared at that time.
| Date/Time | Thumbnail | Dimensions | User | Comment | |
|---|---|---|---|---|---|
| current | 23:13, 16 July 2007 |  | 1,213 × 1,100 (63 KB) | Nihad Hamzic (talk | contribs) | Greatly optimised image size and appearance by replacing dihtered colors with solid ones. The color composition is almost the same as before. It is uniform across all three maps. |
| 21:40, 29 December 2006 |  | 1,213 × 1,100 (218 KB) | Electionworld (talk | contribs) | {{ew|en|Ceha}} == Summary == Population change in BiH Serb population by municipalities in period 1991-2005. Yellow are municipalities in which Serbs had less than 10% in census of 1991, dark red are municipalities in which theirs percentage has grown by |
You cannot overwrite this file.
File usage on Commons
The following 2 pages use this file: