File:Poincare-sphere arrows.svg
Jump to navigation
Jump to search

Size of this PNG preview of this SVG file: 600 × 600 pixels. Other resolutions: 240 × 240 pixels | 480 × 480 pixels | 768 × 768 pixels | 1,024 × 1,024 pixels | 2,048 × 2,048 pixels.
Original file (SVG file, nominally 600 × 600 pixels, file size: 6 KB)
Captions
Captions
Add a one-line explanation of what this file represents
Summary[edit]
| Description |
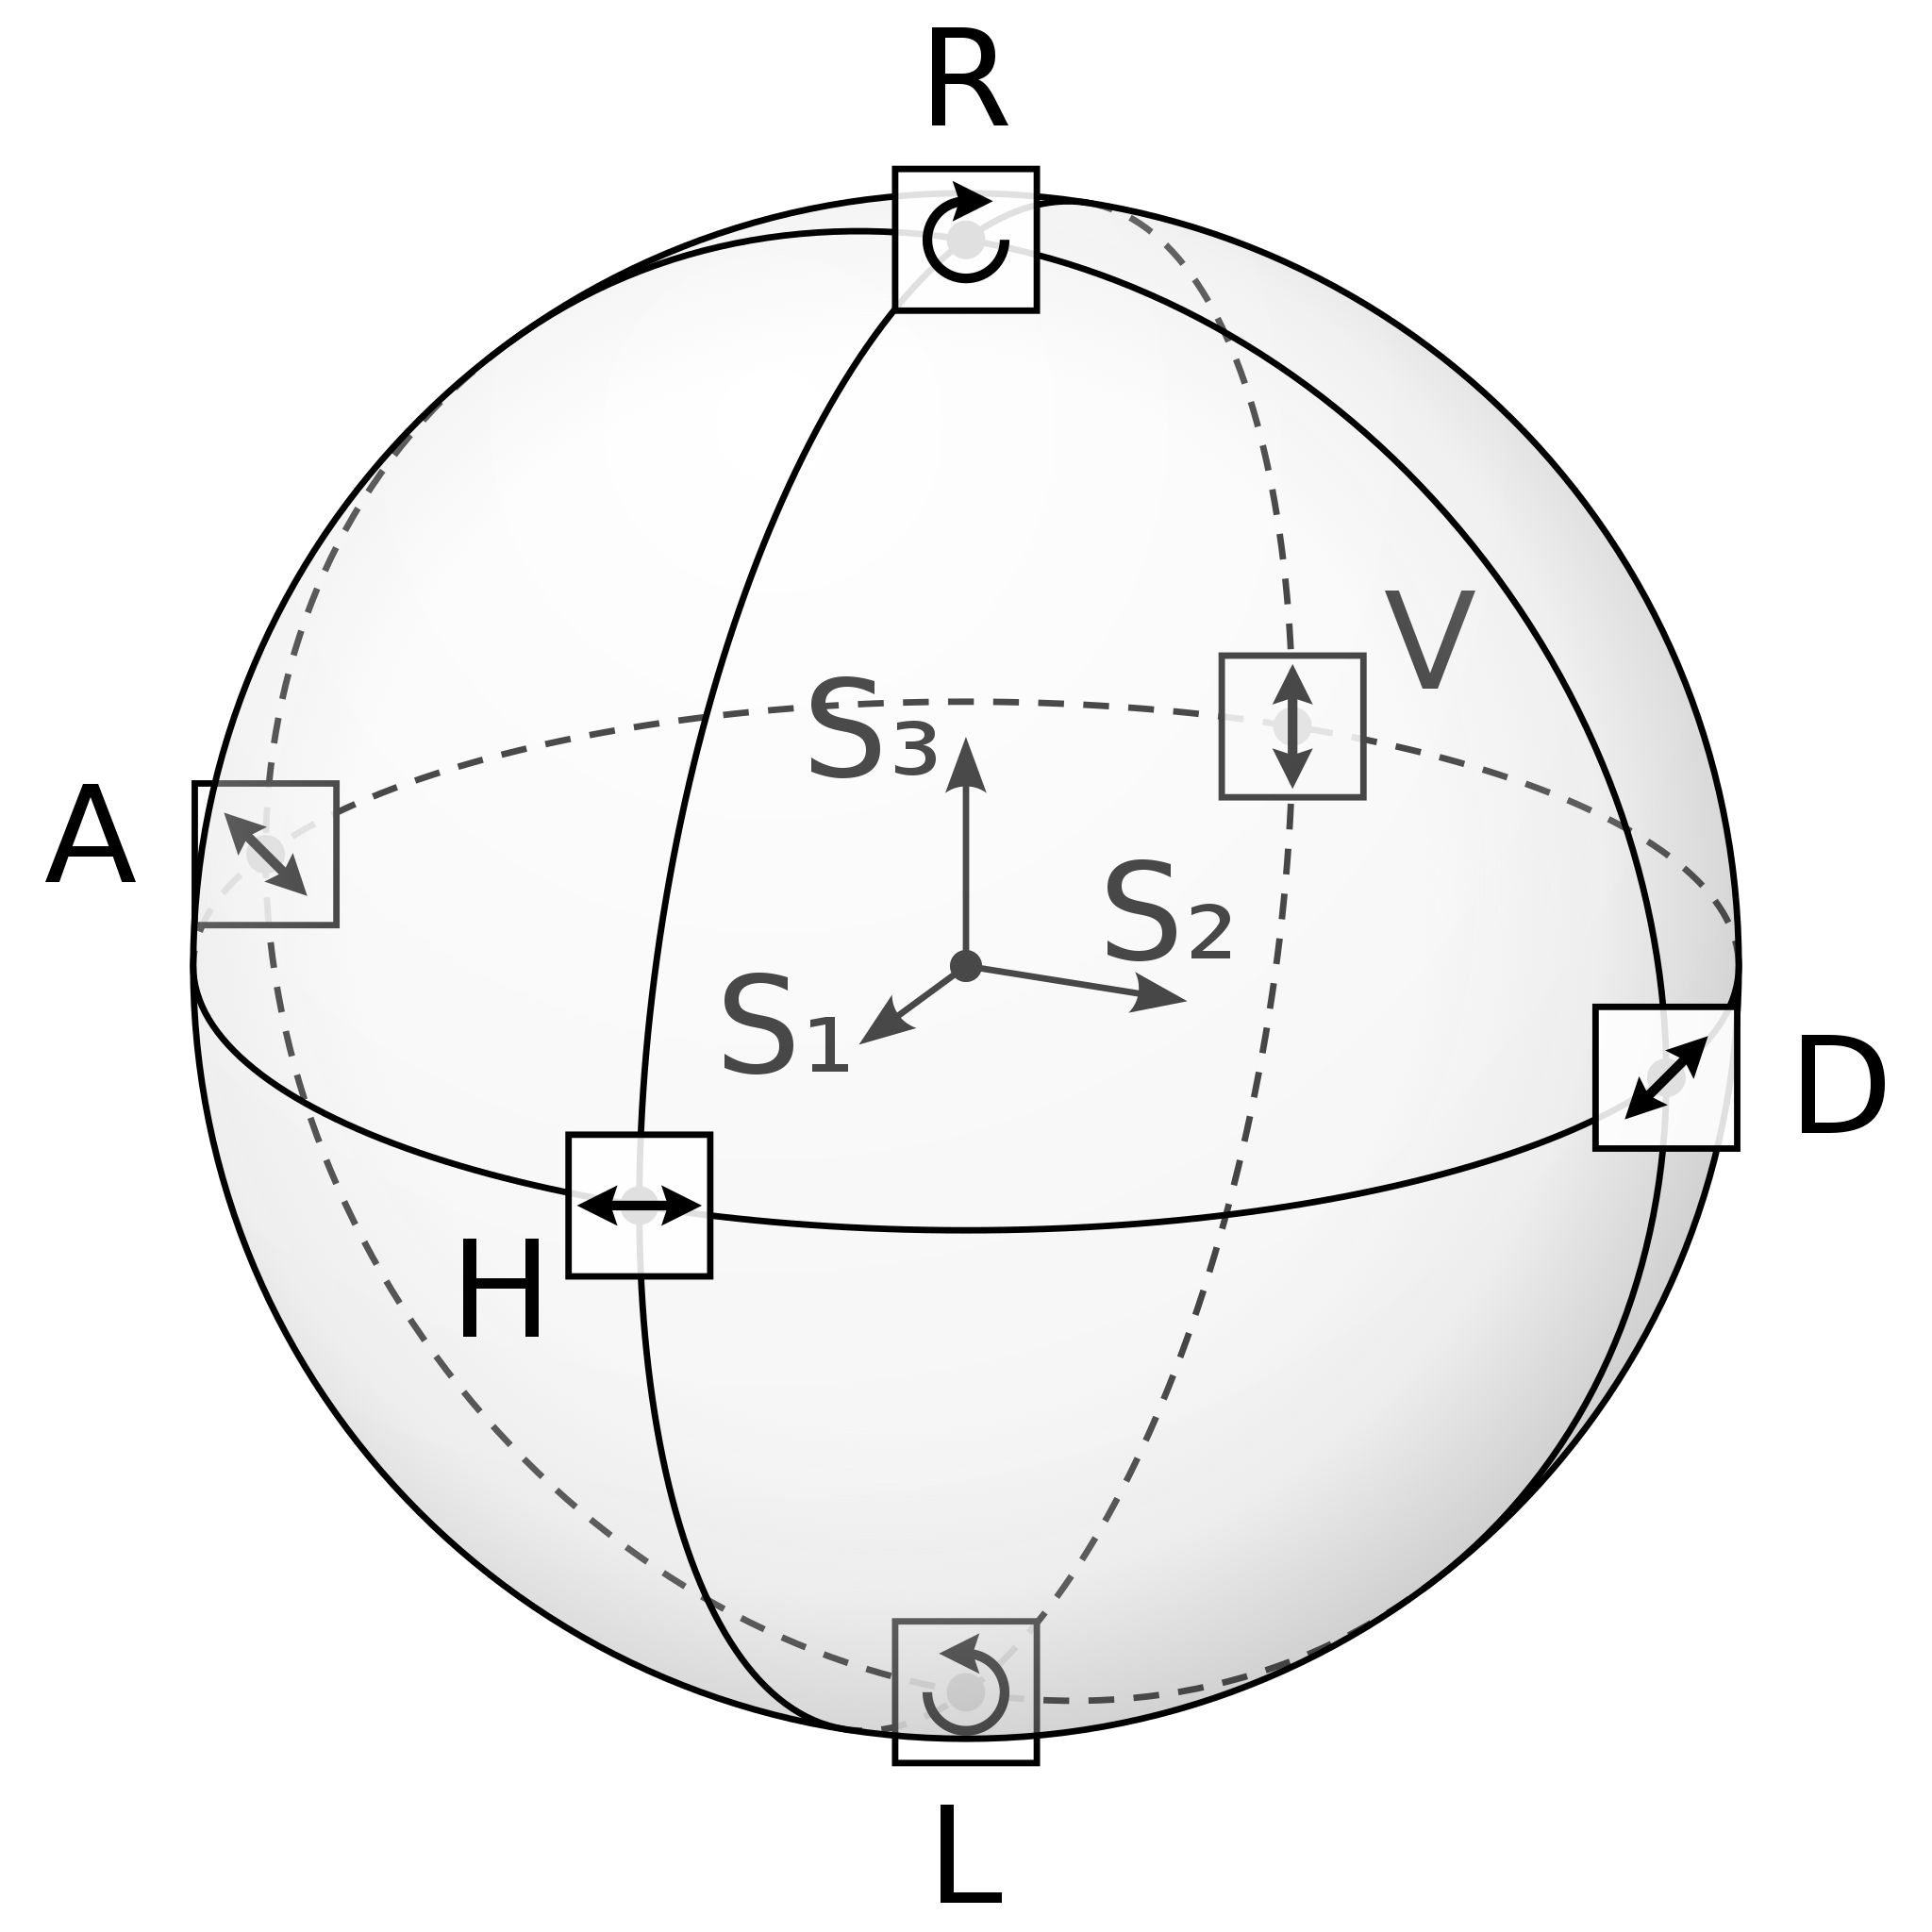
English: Drawing of a Poincaré sphere, which illustrates the space of possible polarisations of electromagnetic waves. The sphere is drawn with three great circles, labels for six basic polarisations H (linear horizontal), V (linear vertical), D (linear diagonal), A (linear antidiagonal), R (right-hand circular) and L (left-hand circular) and images of the polarisation vectors for each. Additionally the coordinate system of Stokes vectors with components S₁, S₂ and S₃ is drawn in the center of the sphere.
Deutsch: Zeichnung einer Poincaré-Kugel, die den Raum der möglichen Polarisationen elektromagnetischer Wellen darstellt. Die Kugel ist mit drei Großkreisen gezeichnet, Zeichen für die sechs Basispolarisationen H (linear horizontal), V (linear vertikal), D (linear diagonal), A (linear antidiagonal), R (rechtshändig zirkular) and L (linkshändig zirkular) und mit Bildern der Polarisationsvektoren für jede davon. Zusätzlich befindet sich im Zentrum der Kugel das Koordinatensystem aus Stokesvektorkomponenten S₁, S₂ and S₃. |
| Date | |
| Source | Own work |
| Author | Geek3 |
| Other versions | Poincare-sphere_stokes.svg (without the small images of the polarisation vectors) |
Source Code[edit]
The image is created by the following source-code. Requirements:
python source code:
try:
    import svgwrite as svg
except ImportError:
    print 'You need to install svgwrite: http://pypi.python.org/pypi/svgwrite/'
    # documentation at http://pythonhosted.org/svgwrite/
    exit(1)

from math import *

def to_xyz(theta, phi, r=1):
    return r * sin(theta) * cos(phi), r * sin(theta) * sin(phi), r * cos(theta)

def to_theta_phi_r(x, y, z):
    return atan2(z, sqrt(x**2 + y**2)), atan2(x, y), sqrt(x**2+y**2+z**2)

def rotx(x, y, z, a):
    y, z = cos(a) * y + sin(a) * z, cos(a) * z - sin(a) * y
    return x, y, z

def ellipse_path(theta, phi, tilt, flip=False):
    t, p, r2 = to_theta_phi_r(*rotx(*(to_xyz(theta, phi, 1) + (tilt,))))
    a = abs(r)
    b = abs(r * sin(t))
    return 'M %f,%f A %f,%f %f %i,%i %f,%f' % (-r*cos(p), -r*sin(p),
        a, b, p*180/pi, 0, {True:1, False:0}[flip], r*cos(p), r*sin(p))

# document
size = 600, 600
doc = svg.Drawing('poincare-sphere_arrows.svg', profile='full', size=size)
doc.set_desc('poincare-sphere_arrows.svg', '''Drawing of a poincare-sphere with polarisations H, V, D, A, R and L, a coordinate system of Stokes-Vectors P1, P2 and P3 and six little images that illustrate the polarisations
rights: GNU Free Documentation license,
        Creative Commons Attribution ShareAlike license''')

# settings
dash = '8,6'
col = 'black'
r = 240
tilt = radians(-70)
phi = radians(-25)
cp, sp = cos(phi), sin(phi)

# background
doc.add(doc.rect(id='background', profile='full', insert=(0, 0), size=size, fill='white', stroke='none'))

# arrow markers
arrow_d = 'M -4,0 L 2,-3 L 1,0 L 2,3 L -4,0 z'
arrow1 = doc.marker(id='arrow1', orient='auto', overflow='visible')
arrow1.add(doc.path(d=arrow_d, fill=col, stroke='none',
    transform='rotate(180) scale(0.7)'))
doc.defs.add(arrow1)
arrow2 = doc.marker(id='arrow2', orient='auto', overflow='visible')
arrow2.add(doc.path(d=arrow_d, fill=col, stroke='none',
    transform='scale(0.7)'))
doc.defs.add(arrow2)
arrow3 = doc.marker(id='arrow3', orient='auto', overflow='visible')
arrow3.add(doc.path(d='M 8.7185878,4.0337352 L -2.2072895,0.016013256 L 8.7185884,-4.0017078 C 6.9730900,-1.6296469 6.9831476,1.6157441 8.7185878,4.0337352 z', fill=col, stroke='none',
    transform='scale(0.8) rotate(180)'))
doc.defs.add(arrow3)

# make a group for the sphere
sphere = doc.g(transform='translate(300, 300)', fill='none', stroke=col, stroke_width='2')
sphere['font-family'] = 'DejaVu Sans'
sphere['font-size'] = '42px'
doc.add(sphere)

# back ellipses
sphere.add(doc.path(d=ellipse_path(0, 0, tilt),
    stroke_dasharray=dash, stroke=col))
sphere.add(doc.path(d=ellipse_path(pi/2, phi, tilt, True),
    stroke_dasharray=dash, stroke=col))
sphere.add(doc.path(d=ellipse_path(pi/2, phi+pi/2, tilt),
    stroke_dasharray=dash, stroke=col))

# draw coordinate axes
sphere.add(doc.circle(center=(0, 0), r=5, fill=col, stroke='none'))
for i in range(3):
    xyz = [0, 0, 0]
    xyz[i] = 0.3 * r
    x, y, z = xyz
    x, y, z = rotx(x*cp + y*sp, y*cp - x*sp, z, tilt)
    line = doc.line(start=(0, 0), end=('%f' % x, '%f' % y), stroke=col)
    line['marker-end'] = arrow3.get_funciri()
    sphere.add(line)

# the six defined points
pts = []
for x,y,z in [[0,0,-1], [0,0,1], [0,-1,0], [0,1,0], [-1,0,0], [1,0,0]]:
    x, y, z = rotx(r * (x*cp + y*sp), r * (y*cp - x*sp), r * z, tilt)
    if z >= 0:
        continue
    pts.append((x, y))
    sphere.add(doc.circle(center=('%f' % x, '%f' % y), r=6,
        fill=col, stroke='none'))

# inset images
rect = doc.rect((-22, -22), (44, 44), fill='white', stroke=col, fill_opacity=0.88)

gV = doc.g(transform='translate(%f, %f)' % pts[1])
gV.add(rect)
gV.add(doc.line(start=(0,-11), end=(0,11), stroke_width=3,
    marker_end=arrow1.get_funciri(), marker_start=arrow2.get_funciri()))
sphere.add(gV)

gA = doc.g(transform='translate(%f, %f)' % pts[2])
gA.add(rect)
gA.add(doc.line(start=(-7,-7), end=(7,7), stroke_width=3,
    marker_end=arrow1.get_funciri(), marker_start=arrow2.get_funciri()))
sphere.add(gA)

gL = doc.g(transform='translate(%f, %f)' % pts[0])
gL.add(rect)
gL.add(doc.path(d='M -12,0 A 12,12 0 1,0 0,-12', stroke_width=3,
    marker_end=arrow1.get_funciri()))
sphere.add(gL)

# V label
sphere.add(doc.text('V', text_anchor='middle',
    transform='translate(144, -86)', stroke='none', fill=col))

# Stokes-Vector labels
sphere.add(doc.text('S₁', text_anchor='middle',
    transform='translate(-56, 33)', stroke='none', fill=col))
sphere.add(doc.text('S₂', text_anchor='middle',
    transform='translate(63, -2)', stroke='none', fill=col))
sphere.add(doc.text('S₃', text_anchor='middle',
    transform='translate(-29, -59)', stroke='none', fill=col))

# sphere surface
grad1 = doc.defs.add(doc.radialGradient(id='grad1',
    center=(0.375, 0.15), r=0.75, gradientUnits='objectBoundingBox'))
grad1.add_stop_color(offset=0, color='#ffffff', opacity=0.3)
grad1.add_stop_color(offset=1, color='#dddddd', opacity=0.3)
sphere.add(doc.circle(center=(0, 0), r=str(r),
    fill='url(#grad1)', stroke='none'))
grad2 = doc.defs.add(doc.radialGradient(id='grad2',
    center=(0.45, 0.45), r=0.575, gradientUnits='objectBoundingBox'))
grad2.add_stop_color(offset=0.6, color='#cccccc', opacity=0)
grad2.add_stop_color(offset=0.8, color='#cccccc', opacity=0.2)
grad2.add_stop_color(offset=1, color='#333333', opacity=0.2)
sphere.add(doc.circle(center=(0, 0), r=str(r),
    fill='url(#grad2)', stroke='none'))

# the six defined points
for x,y,z in [[0,0,-1], [0,0,1], [0,-1,0], [0,1,0], [-1,0,0], [1,0,0]]:
    x, y, z = rotx(r * (x*cp + y*sp), r * (y*cp - x*sp), r * z, tilt)
    if z < 0:
        continue
    pts.append((x, y))
    sphere.add(doc.circle(center=('%f' % x, '%f' % y), r=6,
        fill=col, stroke='none'))

# H, D, A, R, L labels
sphere.add(doc.text('H', text_anchor='middle',
    transform='translate(-144, 115)', stroke='none', fill=col))
sphere.add(doc.text('D', text_anchor='middle',
    transform='translate(272, 52)', stroke='none', fill=col))
sphere.add(doc.text('A', text_anchor='middle',
    transform='translate(-272, -26)', stroke='none', fill=col))
sphere.add(doc.text('R', text_anchor='middle',
    transform='translate(0, -261)', stroke='none', fill=col))
sphere.add(doc.text('L', text_anchor='middle',
    transform='translate(0, 291)', stroke='none', fill=col))

# front ellipses
sphere.add(doc.path(d=ellipse_path(0, 0, tilt, True)))
sphere.add(doc.path(d=ellipse_path(pi/2, phi, tilt)))
sphere.add(doc.path(d=ellipse_path(pi/2, phi+pi/2, tilt, True)))

# circle edge
sphere.add(doc.circle(center=(0, 0), r=str(r)))

# inset images
gH = doc.g(transform='translate(%f, %f)' % pts[4])
gH.add(rect)
gH.add(doc.line(start=(-11,0), end=(11,0), stroke_width=3,
    marker_end=arrow1.get_funciri(), marker_start=arrow2.get_funciri()))
sphere.add(gH)

gD = doc.g(transform='translate(%f, %f)' % pts[5])
gD.add(rect)
gD.add(doc.line(start=(-7,7), end=(7,-7), stroke_width=3,
    marker_end=arrow1.get_funciri(), marker_start=arrow2.get_funciri()))
sphere.add(gD)

gR = doc.g(transform='translate(%f, %f)' % pts[3])
gR.add(rect)
gR.add(doc.path(d='M 12,0 A 12,12 0 1,1 0,-12', stroke_width=3,
    marker_end=arrow1.get_funciri()))
sphere.add(gR)

doc.save()
Licensing[edit]
I, the copyright holder of this work, hereby publish it under the following licenses:

|
Permission is granted to copy, distribute and/or modify this document under the terms of the GNU Free Documentation License, Version 1.2 or any later version published by the Free Software Foundation; with no Invariant Sections, no Front-Cover Texts, and no Back-Cover Texts. A copy of the license is included in the section entitled GNU Free Documentation License. |
This file is licensed under the Creative Commons Attribution 3.0 Unported license.
- You are free:
- to share – to copy, distribute and transmit the work
- to remix – to adapt the work
- Under the following conditions:
- attribution – You must give appropriate credit, provide a link to the license, and indicate if changes were made. You may do so in any reasonable manner, but not in any way that suggests the licensor endorses you or your use.
You may select the license of your choice.
File history
Click on a date/time to view the file as it appeared at that time.
| Date/Time | Thumbnail | Dimensions | User | Comment | |
|---|---|---|---|---|---|
| current | 17:44, 31 August 2014 | | 600 × 600 (6 KB) | Geek3 (talk | contribs) | Poincare Sphere with Stokes vectors and polarisation arrows |
You cannot overwrite this file.
File usage on Commons
The following page uses this file:
File usage on other wikis
The following other wikis use this file:
- Usage on ar.wikipedia.org
- Usage on de.wikipedia.org