File:Penny-Arcade-Expo-Attendance.svg
Jump to navigation
Jump to search

Size of this PNG preview of this SVG file: 600 × 480 pixels. Other resolutions: 300 × 240 pixels | 960 × 768 pixels | 1,280 × 1,024 pixels | 2,560 × 2,048 pixels.
Original file (SVG file, nominally 600 × 480 pixels, file size: 12 KB)
Captions
Captions
Add a one-line explanation of what this file represents
Summary[edit]
| Description |
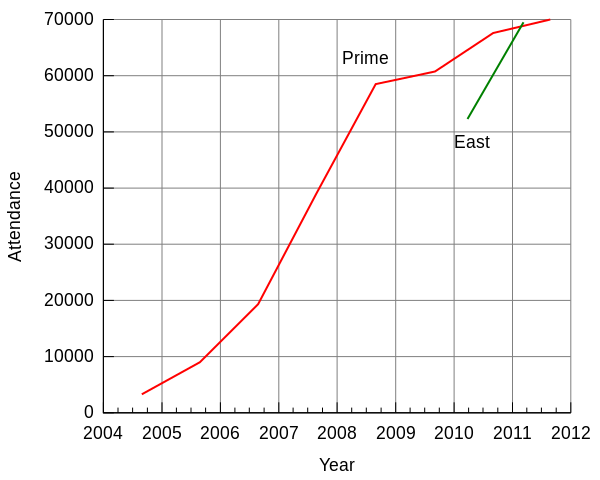
English: Graph of w:Penny Arcade Expo attendance, based on numbers as reported in that article.
Creation and UpdatesThis graph was created with w:gnuplot. The files used to create it are below. If there is new, cited data at w:Penny Arcade Expo, feel free to alert me and I'll be happy to update this graph. The file "cmd" contained the following: set terminal svg fname "Arial" fsize 14 set ylabel "Attendance" set xlabel "Year" set datafile missing 'NA' unset key set grid back lw 1 set border 3 set ytics nomirror set xtics nomirror set xdata time set timefmt "%Y-%m-%d" set format x "%Y" set label "Prime" at "2008-02-01",63000 set label "East" at "2010-01-01",48000 plot \ "pax.csv" using 1:2 with lines lw 2 \ ,"pax.csv" using 3:4 with lines lw 2 The file pax.csv contained: # Dates are the start date.
# Dates and attendance are as reported in the
# English Wikipedia article "Penny Arcade Expo".
# PRIME EAST
# Date Attend Date Attend
2004-08-28 3300 NA NA
2005-08-26 9000 NA NA
2006-08-25 19323 NA NA
2007-08-24 39000 NA NA
2008-08-29 58500 NA NA
2009-09-04 60750 NA NA
2010-09-03 67600 2010-03-26 52290
2011-08-26 270000 2011-03-11 69500
NA NA 2012-04-06 NA
The output was created with the command: gnuplot < cmd > out.svg |
| Date | |
| Source | Own work |
| Author | Alan De Smet |
Licensing[edit]
I, Alan De Smet disclaim any copyright on this image. It is a mechanical creation by gnuplot with negligible creative input. The data itself cannot be copyrighted.
| I, the copyright holder of this work, release this work into the public domain. This applies worldwide. In some countries this may not be legally possible; if so: I grant anyone the right to use this work for any purpose, without any conditions, unless such conditions are required by law. |
File history
Click on a date/time to view the file as it appeared at that time.
| Date/Time | Thumbnail | Dimensions | User | Comment | |
|---|---|---|---|---|---|
| current | 02:57, 9 March 2012 | | 600 × 480 (12 KB) | Alan De Smet (talk | contribs) | Added PAX Prime 2011 attendance |
| 01:25, 15 March 2011 |  | 600 × 480 (12 KB) | Alan De Smet (talk | contribs) | Data values now tied to exact dates, not just years. Less confusing given the half-year separation between PAX Prime and PAX East. | |
| 01:04, 15 March 2011 |  | 600 × 480 (11 KB) | Alan De Smet (talk | contribs) | Added PAX East 2011 data point. | |
| 02:49, 11 March 2011 |  | 600 × 480 (11 KB) | Alan De Smet (talk | contribs) | Added PAX Prime 2010 attendance. | |
| 02:30, 19 August 2010 |  | 600 × 480 (11 KB) | Alan De Smet (talk | contribs) | ||
| 02:14, 15 October 2009 |  | 600 × 480 (9 KB) | Alan De Smet (talk | contribs) | {{Information |Description={{en|1=Graph of w:Penny Arcade Expo attendance, based on numbers as reported in that article. ===Creation and Updates=== This graph was created with w:gnuplot. The files used to create it are below. If there is new, |
You cannot overwrite this file.
File usage on Commons
There are no pages that use this file.
File usage on other wikis
The following other wikis use this file:
- Usage on de.wikipedia.org
- Usage on en.wikipedia.org