File:Pearson type VII distribution log-PDF.png
Jump to navigation
Jump to search

Size of this preview: 800 × 600 pixels. Other resolutions: 320 × 240 pixels | 640 × 480 pixels | 1,024 × 768 pixels | 1,280 × 960 pixels | 1,600 × 1,200 pixels.
Original file (1,600 × 1,200 pixels, file size: 185 KB, MIME type: image/png)
Captions
Captions
Add a one-line explanation of what this file represents
Image summary[edit]
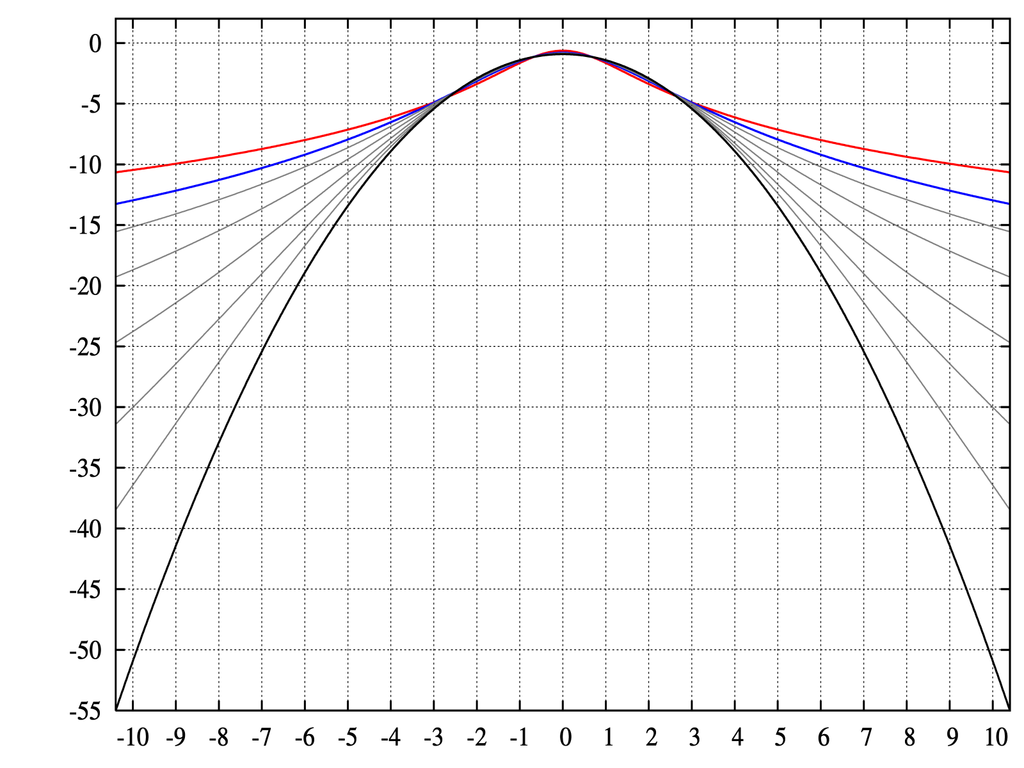
Natural logarithm of the probability density of the Pearson type VII distribution
The red curve shows the limiting density with infinite kurtosis; the blue curve shows the density with kurtosis equal to 2; the black curve shows the limiting (normal) density with zero kurtosis. The gray curves (between the blue and the black) show densities with kurtoses 1, 1/2, 1/4, 1/8, and 1/16.
| I, the copyright holder of this work, release this work into the public domain. This applies worldwide. In some countries this may not be legally possible; if so: I grant anyone the right to use this work for any purpose, without any conditions, unless such conditions are required by law. |
See also[edit]
For further background and gnuplot source code, see Image:Pearson type VII distribution PDF.png.

|
File:Pearson type VII distribution log-PDF.svg is a vector version of this file. It should be used in place of this PNG file when not inferior.
File:Pearson type VII distribution log-PDF.png → File:Pearson type VII distribution log-PDF.svg
For more information, see Help:SVG. |
 |
File history
Click on a date/time to view the file as it appeared at that time.
| Date/Time | Thumbnail | Dimensions | User | Comment | |
|---|---|---|---|---|---|
| current | 22:05, 2 October 2016 | | 1,600 × 1,200 (185 KB) | Cmdrjameson (talk | contribs) | Compressed with pngout. Reduced by 97kB (34% decrease). |
| 00:38, 6 December 2006 |  | 1,600 × 1,200 (282 KB) | MarkSweep (talk | contribs) | Natural logarithm of the probability density of the Pearson type VII distribution |
You cannot overwrite this file.
File usage on Commons
The following page uses this file: