File:PCA of Afghanistan populations and others.png
Jump to navigation
Jump to search

Size of this preview: 800 × 510 pixels. Other resolutions: 320 × 204 pixels | 640 × 408 pixels | 1,024 × 652 pixels | 1,280 × 816 pixels | 2,067 × 1,317 pixels.
Original file (2,067 × 1,317 pixels, file size: 891 KB, MIME type: image/png)
Captions
Captions
Add a one-line explanation of what this file represents
Summary
[edit]| Description |
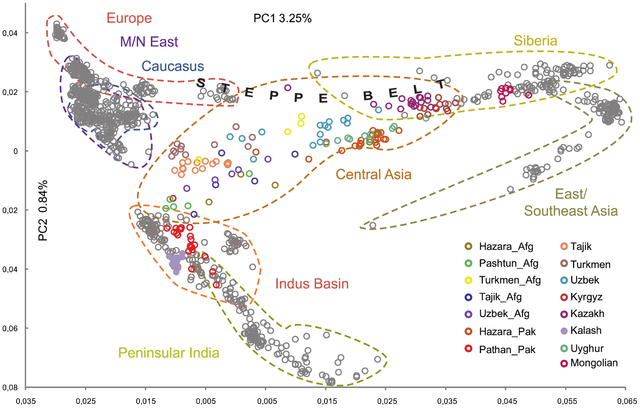
English: First and second components of the Principal Component Analysis based on autosomal data.
The corresponding colored dots for the Central Asian populations are shown on the lower right corner. The colored “arrows” on the background represent the frequency gradients as seen as on Figures S1 and S2 and follow the same color code. It shall be stressed that they DO NOT represent actual gene flow, PCA analysis does not permit to reveal such movements. _Pak and _Afg stand for Pakistan and Afghanistan respectively. |
| Date | Published: October 18, 2013 |
| Source | Di Cristofaro J, Pennarun E, Mazières S, Myres NM, Lin AA, Temori SA, et al. (2013) Afghan Hindu Kush: Where Eurasian Sub-Continent Gene Flows Converge. PLoS ONE 8(10): e76748. https://doi.org/10.1371/journal.pone.0076748 |
| Author | Julie Di Cristofaro, Erwan Pennarun, Stéphane Mazières, Natalie M. Myres, Alice A. Lin, Shah Aga Temori, Mait Metspalu, Ene Metspalu, Michael Witzel, Roy J. King, Peter A. Underhill, Richard Villems, Jacques Chiaroni |
| Other versions |
|


Licensing
[edit]
This file is licensed under the Creative Commons Attribution 4.0 International license.
- You are free:
- to share – to copy, distribute and transmit the work
- to remix – to adapt the work
- Under the following conditions:
- attribution – You must give appropriate credit, provide a link to the license, and indicate if changes were made. You may do so in any reasonable manner, but not in any way that suggests the licensor endorses you or your use.
File history
Click on a date/time to view the file as it appeared at that time.
| Date/Time | Thumbnail | Dimensions | User | Comment | |
|---|---|---|---|---|---|
| current | 21:03, 14 January 2021 | | 2,067 × 1,317 (891 KB) | Was a bee (talk | contribs) | {{Information |Description={{en|1=First and second components of the Principal Component Analysis based on autosomal data. The corresponding colored dots for the Central Asian populations are shown on the lower right corner. The colored “arrows” on the background represent the frequency gradients as seen as on Figures S1 and S2 and follow the same color code. It shall be stressed that they DO NOT represent actual gene flow, PCA analysis does not permit to reveal such movements. _Pak and _Afg... |
You cannot overwrite this file.
File usage on Commons
The following 3 pages use this file: