File:Oil consumption per day by region from 1980 to 2006 no labels.svg
From Wikimedia Commons, the free media repository
Jump to navigation
Jump to search

Size of this PNG preview of this SVG file: 600 × 450 pixels. Other resolutions: 320 × 240 pixels | 640 × 480 pixels | 1,024 × 768 pixels | 1,280 × 960 pixels | 2,560 × 1,920 pixels.
Original file (SVG file, nominally 600 × 450 pixels, file size: 98 KB)
File information
Structured data
Captions
Captions
Add a one-line explanation of what this file represents
| DescriptionOil consumption per day by region from 1980 to 2006 no labels.svg |
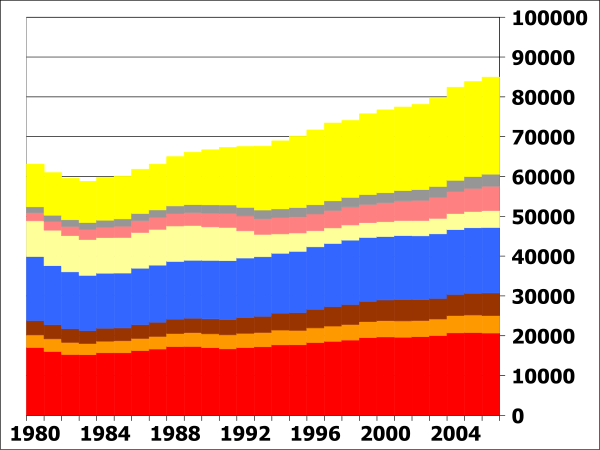
English: Oil consumption in daily barrels per region from 1980 to 2006; vertical extents indicate thousands of barrels of oil consumed per day, and the horizontal scale shows years from 1980 to 2006. From bottom to top the regions are: United States in red, Canada and Mexico in orange, Central and South America in brown, Europe in blue, Eurasia in cream, Middle East in pink, Africa in grey, and Asia and Oceania in yellow. |
| Date | |
| Source | I, 84user, created this work using the excel file RecentPetroleumConsumptionBarrelsperDay.xls from the U.S. Energy Information Administration's web page http://tonto.eia.doe.gov/dnav/pet/pet_pri_wco_k_w.htm (direct link: http://www.eia.doe.gov/emeu/international/RecentPetroleumConsumptionBarrelsperDay.xls) and using Open Source Gnumeric 1.9.1 to produce the chart. |
| Author | 84user |
| Permission (Reusing this file) |
PD-SELF; Released into the public domain (by the author). |
| Other versions |
 |
See also[edit]


Licensing[edit]
| Public domainPublic domainfalsefalse |
| This work has been released into the public domain by its author, 84user. This applies worldwide. In some countries this may not be legally possible; if so: |
File history
Click on a date/time to view the file as it appeared at that time.
| Date/Time | Thumbnail | Dimensions | User | Comment | |
|---|---|---|---|---|---|
| current | 15:08, 25 October 2008 |  | 600 × 450 (98 KB) | 84user (talk | contribs) | {{Information |Description={{en|Oil consumption in daily barrels per region from 1980 to 2006; vertical extents indicate thousands of barrels of oil consumed per day, and the horizontal scale shows years from 1980 to 2006. From bottom to top the regions a |
You cannot overwrite this file.
File usage on Commons
Hidden category: