File:Near selerika 1990-2019 1.svg

Original file (SVG file, nominally 1,080 × 720 pixels, file size: 41 KB)
Captions
Captions
Summary[edit]
| Description |
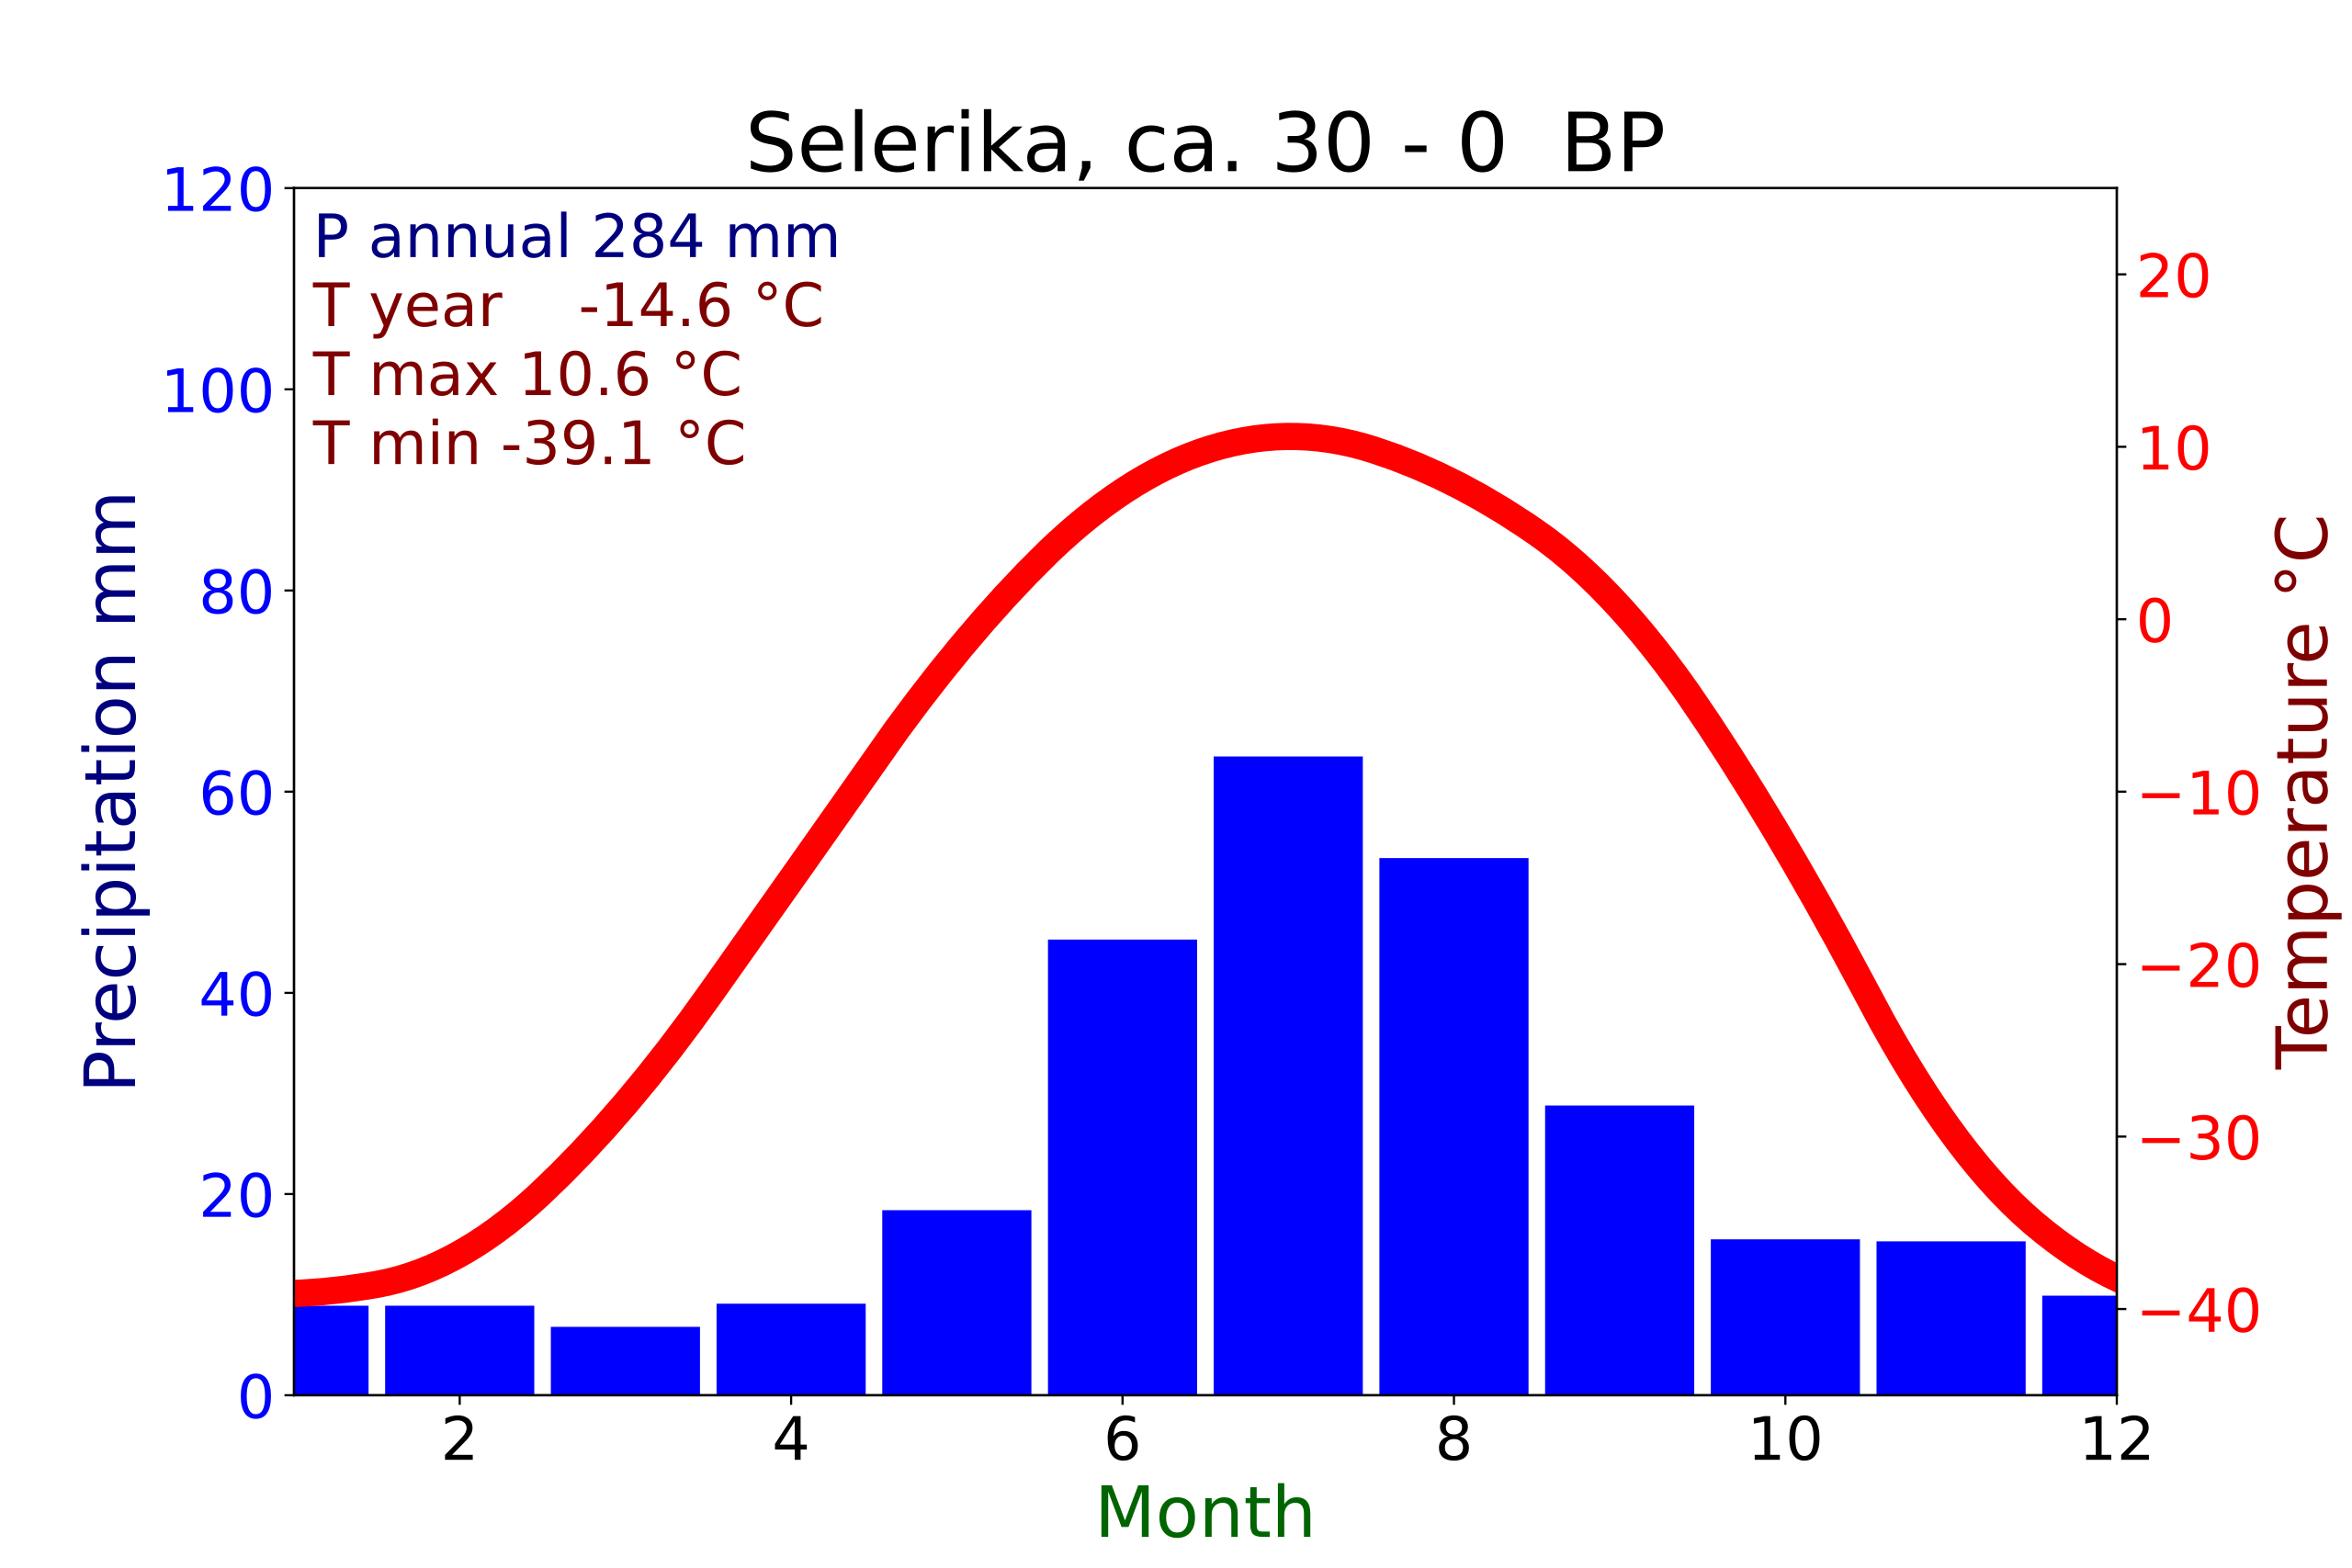
English: Climate near Selerika 1990-2019 |
| Date | |
| Source | Own work |
| Author | Merikanto |
| Camera location | | View this and other nearby images on: OpenStreetMap |
|---|
Source of data to fraw image is [1]
Data is processed wwith text edittor and drawn with python script
Data
Month;T;P 1;-39.1;8.9 2;-36.8;8.9 3;-28.1;6.8 4;-15.1;9.1 5;-1.9;18.4 6;7.4;45.3 7;10.6;63.5 8;7.9;53.4 9;0.7;28.8 10;-13.2;15.5 11;-29.7;15.3 12;-38.2;9.9
Python script
- drawing climate diagram in python 3
- version 2.11
- 11.9.2020
-
import matplotlib.pyplot as plt
import numpy as np
import pandas as pd
from scipy import interpolate
import sys
print ('Argument List:', str(sys.argv))
pohjanimi=sys.argv[1]
ika=sys.argv[2]
isonimi=pohjanimi.capitalize()
print(pohjanimi, isonimi, ika)
- quit(-1)
pohjanimi="selerika"
ika="ca. 30 - 0 "
captioni=isonimi+", "+ika+" BP"
maxrainfall=120
mintemperature=-60
maxtemperature=20
datafilename=pohjanimi+".csv"
savename=pohjanimi+"_"+ika+"_climate_diagram.svg"
figsizex=12
figsizey=8
x0 = []
y0 = []
y20= []
x = []
y = []
y2= []
dfin0=pd.read_csv(datafilename, sep=";")
lst1 = ['Month','T','P']
dfin1 = dfin0[dfin0.columns.intersection(lst1)]
x0=dfin1['Month']
y0=dfin1['T']
y20=dfin1['P']
x.append(0)
y.append(y0[11])
y2.append(y0[11])
for n in range(0, 12):
	x.append(x0[n])
	y.append(y0[n])
	y2.append(y20[n])
x.append(13)
y.append(y0[0])
y2.append(y0[0])
print(x)
- print(y)
- print (type(x))
- print (type(y))
- quit(0)
yearprecip=0
yeartemp=0
for n in range(1, 13):
	yearprecip=yearprecip+y2[n]
	yeartemp=yeartemp+y[n]
	print (n,y[n],y2[n])


size1=22
size2=26
size3=30
yeartemp=round((yeartemp/12.0),1)
mintemp=min(y)
maxtemp=max(y)
yearprecip=round(yearprecip,0)
maxprecip=max(y2)
minprecip=min(y2)
print(yearprecip)
print(minprecip)
print(maxprecip)
print(yeartemp)
print(mintemp)
print(maxtemp)
ymax1=int((maxprecip+60)/20)*20
ymax2=int((maxtemp+15)/5)*5
ymin2=int((mintemp-10)/5)*5
x_sm = np.array(x)
y_sm = np.array(y)
x_smooth = np.linspace(x_sm.min(), x_sm.max(), 200)
funk1 = interpolate.interp1d(x_sm, y_sm, kind="quadratic")
y_smooth = funk1(x_smooth)
fig, ax1 = plt.subplots()
- plt.rcParams["figure.figsize"] = (12,16)
ax1.axis((1,12,0,ymax1))
ax1.bar(x, y2, color='#0000ff', label="Precip. mm", width=0.9, align="center")
ax1.set_ylabel('Precipitation mm', color='#00007f', fontsize=size2)
for tl in ax1.get_yticklabels():
tl.set_color('b')
tl.set_fontsize(size1)
ax2 = ax1.twinx()
ax2.set_ylabel('Temperature °C', color='#7f0000', fontsize=size2)
ax2.axis((1,12,ymin2, ymax2))
- ax2.plot(x,y, label='Temperature °C',color="#ff0000", linewidth=7)
ax2.plot(x_smooth,y_smooth, label='Temperature °C',color="red", linewidth=10)
for t2 in ax2.get_yticklabels():
t2.set_color('r')
t2.set_fontsize(size1)
ax1.set_xlabel('Month', color="darkgreen", fontsize=size2)
for tix in ax1.get_xticklabels():
tix.set_color("Black")
tix.set_fontsize(size1)
ax1.set_title(captioni, fontsize=size3)
ax2.text(1, ymax2-4, " P annual "+str(int(yearprecip))+ " mm", color="#00007f", fontsize=size1)
ax2.text(1, ymax2-8, " T year    "+str(yeartemp) + " °C", color="#7f0000",fontsize=size1)
ax2.text(1, ymax2-12, " T max "+str(maxtemp)+ " °C", color="#7f0000", fontsize=size1)
ax2.text(1, ymax2-16, " T min "+str(mintemp) + " °C", color="#7f0000",fontsize=size1)
fig = plt.gcf()
fig.set_size_inches(figsizex, figsizey, forward=True)
plt.plot()
plt.savefig(savename, format="svg", dpi = 100)
plt.show()
Licensing[edit]
- You are free:
- to share – to copy, distribute and transmit the work
- to remix – to adapt the work
- Under the following conditions:
- attribution – You must give appropriate credit, provide a link to the license, and indicate if changes were made. You may do so in any reasonable manner, but not in any way that suggests the licensor endorses you or your use.
- share alike – If you remix, transform, or build upon the material, you must distribute your contributions under the same or compatible license as the original.
- ↑ Laura Zepner, Pierre Karrasch, Felix Wiemann & Lars Bernard (2020) ClimateCharts.net – an interactive climate analysis web platform, International Journal of Digital Earth, DOI: 10.1080/17538947.2020.1829112
File history
Click on a date/time to view the file as it appeared at that time.
| Date/Time | Thumbnail | Dimensions | User | Comment | |
|---|---|---|---|---|---|
| current | 17:35, 30 October 2021 | | 1,080 × 720 (41 KB) | Merikanto (talk | contribs) | Uploaded own work with UploadWizard |
You cannot overwrite this file.
File usage on Commons
The following page uses this file: