File:Modeling relic DNA dynamics.jpg

Original file (1,280 × 1,080 pixels, file size: 110 KB, MIME type: image/jpeg)
Captions
Captions


Summary[edit]
| Description |
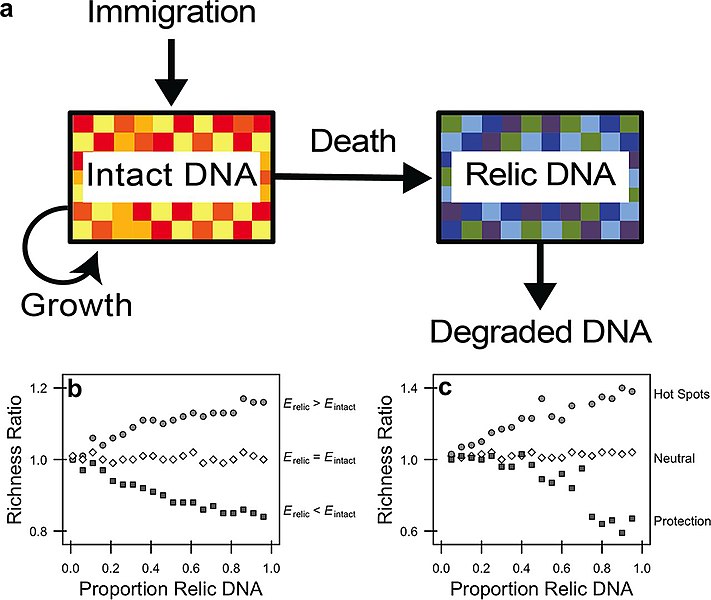
English: Modeling relic DNA dynamics (a) The amount of relic DNA in a microbial environment is determined by inputs associated with the mortality of viable individuals with intact DNA and by losses associated with the degradation of relic DNA. If the diversity of sequences contained in the relic DNA pool is sufficiently different from that in the intact DNA pool, then relic DNA may bias estimates of microbial biodiversity (as indicated by different colored boxes) when sampling from the total (intact + relic) DNA pool. To explore how degradation alters the SAD of the relic community, we explored three scenarios. First, we simulated a neutral scenario where relic DNA sequences produced by different species degrade at the same rate. Second, we simulated conditions under which physical, chemical, or biological processes reduce the degradation rate of relic DNA belonging to some species via protection. Third, we simulated “hot spots” where more abundant relic DNA sequences experience higher rates of relic DNA degradation, a condition that may arise in structured habitats where there are patchy distributions of individuals and their metabolic products (i.e., enzymes). We ran simulations for 10,000 time steps and then sampled the intact and relic communities. To quantify bias in diversity (b and c), we calculated “richness ratios” which reflect the number of species in the total DNA pool (intact + relic) divided by the number of species in the intact DNA pool in a simulation. |
| Date | |
| Source | [1] doi:10.1128/mBio.00637-18 |
| Author | J. T. Lennon, M. E. Muscarella, S. A. Placella and B. K. Lehmkuhl |
Licensing[edit]
- You are free:
- to share – to copy, distribute and transmit the work
- to remix – to adapt the work
- Under the following conditions:
- attribution – You must give appropriate credit, provide a link to the license, and indicate if changes were made. You may do so in any reasonable manner, but not in any way that suggests the licensor endorses you or your use.
- share alike – If you remix, transform, or build upon the material, you must distribute your contributions under the same or compatible license as the original.
File history
Click on a date/time to view the file as it appeared at that time.
| Date/Time | Thumbnail | Dimensions | User | Comment | |
|---|---|---|---|---|---|
| current | 02:10, 2 February 2021 | | 1,280 × 1,080 (110 KB) | Epipelagic (talk | contribs) | Uploaded a work by J. T. Lennon, M. E. Muscarella, S. A. Placella and B. K. Lehmkuhl from [https://mbio.asm.org/content/9/3/e00637-18] {{doi|10.1128/mBio.00637-18}} with UploadWizard |
You cannot overwrite this file.
File usage on Commons
There are no pages that use this file.
File usage on other wikis
The following other wikis use this file:
- Usage on en.wikipedia.org