File:Mercury output2.PNG
Original file (1,425 × 625 pixels, file size: 57 KB, MIME type: image/png)
Captions
Captions
Summary[edit]
| Description |
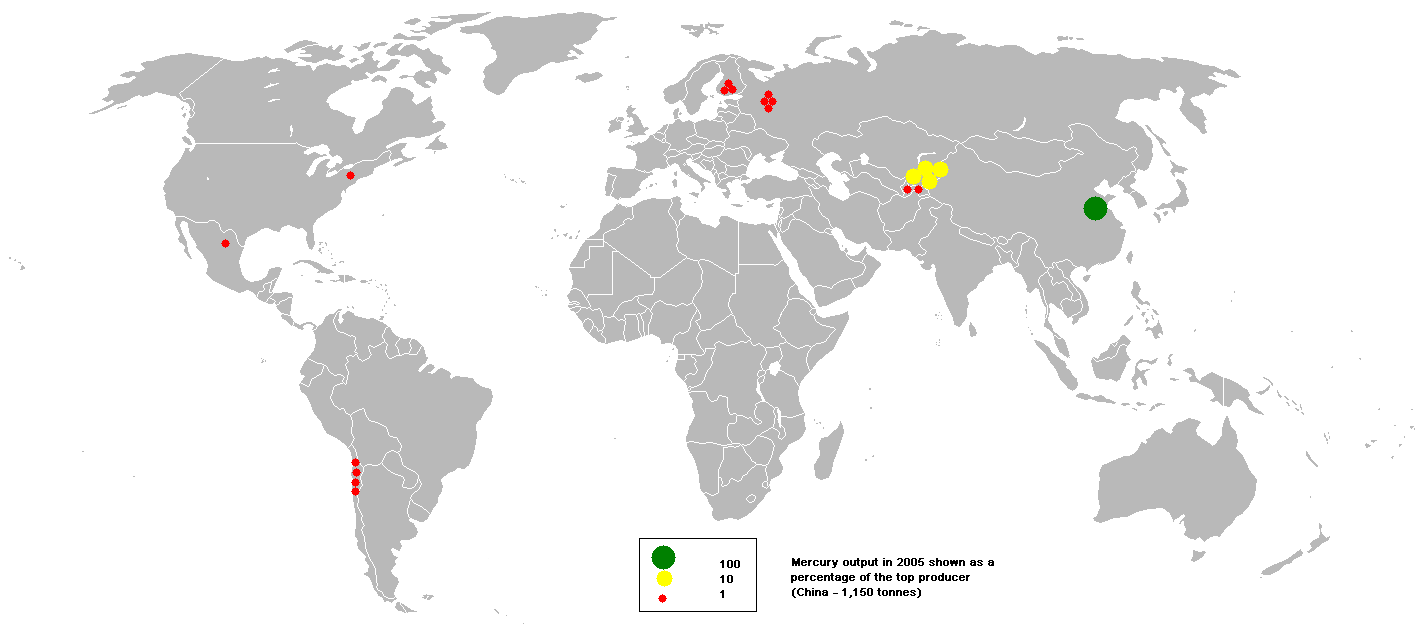
English: This bubble map shows the global distribution of mercury output in 2005 as a percentage of the the top producer (China - 1,150 tonnes).
This map is consistent with incomplete set of data too as long as the top producer is known. It resolves the accessibility issues faced by colour-coded maps that may not be properly rendered in old computer screens. Data was extracted on 30th May 2007. Source - http://www.bgs.ac.uk/mineralsuk/commodity/world/home.html Based on Image:BlankMap-World.png |
| Date | |
| Source | Own work |
| Author | Anwar saadat |

|
File:Mercury output2.svg is a vector version of this file. It should be used in place of this PNG file when not inferior.
File:Mercury output2.PNG → File:Mercury output2.svg
For more information, see Help:SVG. |
 |
Licensing[edit]
| |
This work has been released into the public domain by its author, Anwar saadat, at the English Wikipedia project. This applies worldwide. In case this is not legally possible: |
Original upload log[edit]
- 2007-05-30 19:03 Anwar saadat 1425×625×8 (58487 bytes)
File history
Click on a date/time to view the file as it appeared at that time.
| Date/Time | Thumbnail | Dimensions | User | Comment | |
|---|---|---|---|---|---|
| current | 18:05, 26 January 2008 | | 1,425 × 625 (57 KB) | File Upload Bot (Magnus Manske) (talk | contribs) | {{BotMoveToCommons|en.wikipedia}} {{Information |Description={{en|This bubble map shows the global distribution of mercury output in 2005 as a percentage of the the top producer (China - 1,150 tonnes). This map is consistent with incomplete set of data |
You cannot overwrite this file.
File usage on Commons
There are no pages that use this file.
File usage on other wikis
The following other wikis use this file:
- Usage on es.wikipedia.org
- Usage on fa.wikipedia.org
- Usage on fi.wikipedia.org
- Usage on ro.wikipedia.org
- Usage on sl.wikipedia.org