File:MS in Iran 2008-2015.svg
Jump to navigation
Jump to search

Size of this PNG preview of this SVG file: 720 × 540 pixels. Other resolutions: 320 × 240 pixels | 640 × 480 pixels | 1,024 × 768 pixels | 1,280 × 960 pixels | 2,560 × 1,920 pixels.
Original file (SVG file, nominally 720 × 540 pixels, file size: 32 KB)
Captions
Captions
Add a one-line explanation of what this file represents
Summary[edit]
| Description |
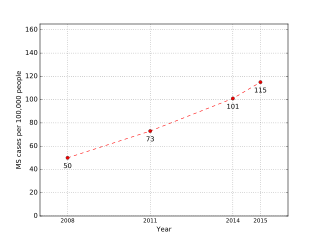
فارسی: شمار موارد شناساییشده از بیماری اماس در ایران. ایران از نظر شیوع این بیماری رتبهٔ اول را در خاورمیانه دارد و آمار نشان میدهد موارد ابتلا به این بیماری در حال افزایش است. |
| Date | |
| Source | Own work |
| Author | Dalba |
Licensing[edit]
I, the copyright holder of this work, hereby publish it under the following license:
This file is licensed under the Creative Commons Attribution-Share Alike 4.0 International license.
- You are free:
- to share – to copy, distribute and transmit the work
- to remix – to adapt the work
- Under the following conditions:
- attribution – You must give appropriate credit, provide a link to the license, and indicate if changes were made. You may do so in any reasonable manner, but not in any way that suggests the licensor endorses you or your use.
- share alike – If you remix, transform, or build upon the material, you must distribute your contributions under the same or compatible license as the original.
Source[edit]
#!/usr/bin/env python
"""Prevalence of MS in Iran.

Source of data: http://isna.ir/fa/news/95030301371/

"""

import numpy as np
import matplotlib.pyplot as plt

years = (2008, 2011, 2014, 2015)
per_100000 = (50, 73, 101, 115)

ys = np.array(per_100000)
xs = np.array(years)

fig = plt.figure()
ax = fig.add_subplot(111)

axistexts = ax.set_xticklabels([str(x) for x in xs])

plt.setp(axistexts, fontsize=10, clip_on=False)
plt.tick_params(
    axis='x',          # changes apply to the x-axis
    which='both',      # both major and minor ticks are affected
    bottom='off',      # ticks along the bottom edge are off
    top='off',         # ticks along the top edge are off
    labelbottom='on'   # labels along the bottom edge are on
)


plt.xlim(xs[0] - 1, xs[-1] + 1)
plt.xticks(xs, xs)
plt.xlabel('Year')
plt.ylim(0, max(ys) + min(ys))
plt.yticks()
plt.ylabel('MS cases per 100,000 people')

plt.plot(xs, ys, '--ro')
plt.grid(True)

for x, y in zip(xs, ys):
    plt.text(x, y - 10, str(y), ha='center', va='bottom')

plt.savefig('MS_in_Iran_2008-2015.svg')
plt.show()
File history
Click on a date/time to view the file as it appeared at that time.
| Date/Time | Thumbnail | Dimensions | User | Comment | |
|---|---|---|---|---|---|
| current | 04:46, 25 May 2016 | | 720 × 540 (32 KB) | Dalba (talk | contribs) | User created page with UploadWizard |
You cannot overwrite this file.
File usage on Commons
There are no pages that use this file.
File usage on other wikis
The following other wikis use this file:
- Usage on fa.wikipedia.org