File:Logistic Map Bifurcation Diagram, Matplotlib, zoomed.png
Jump to navigation
Jump to search

Size of this preview: 800 × 600 pixels. Other resolutions: 320 × 240 pixels | 640 × 480 pixels | 1,024 × 768 pixels | 1,280 × 960 pixels | 2,560 × 1,920 pixels | 3,840 × 2,880 pixels.
Original file (3,840 × 2,880 pixels, file size: 7.34 MB, MIME type: image/png)
Captions
Captions
Add a one-line explanation of what this file represents
Summary[edit]
| Description |
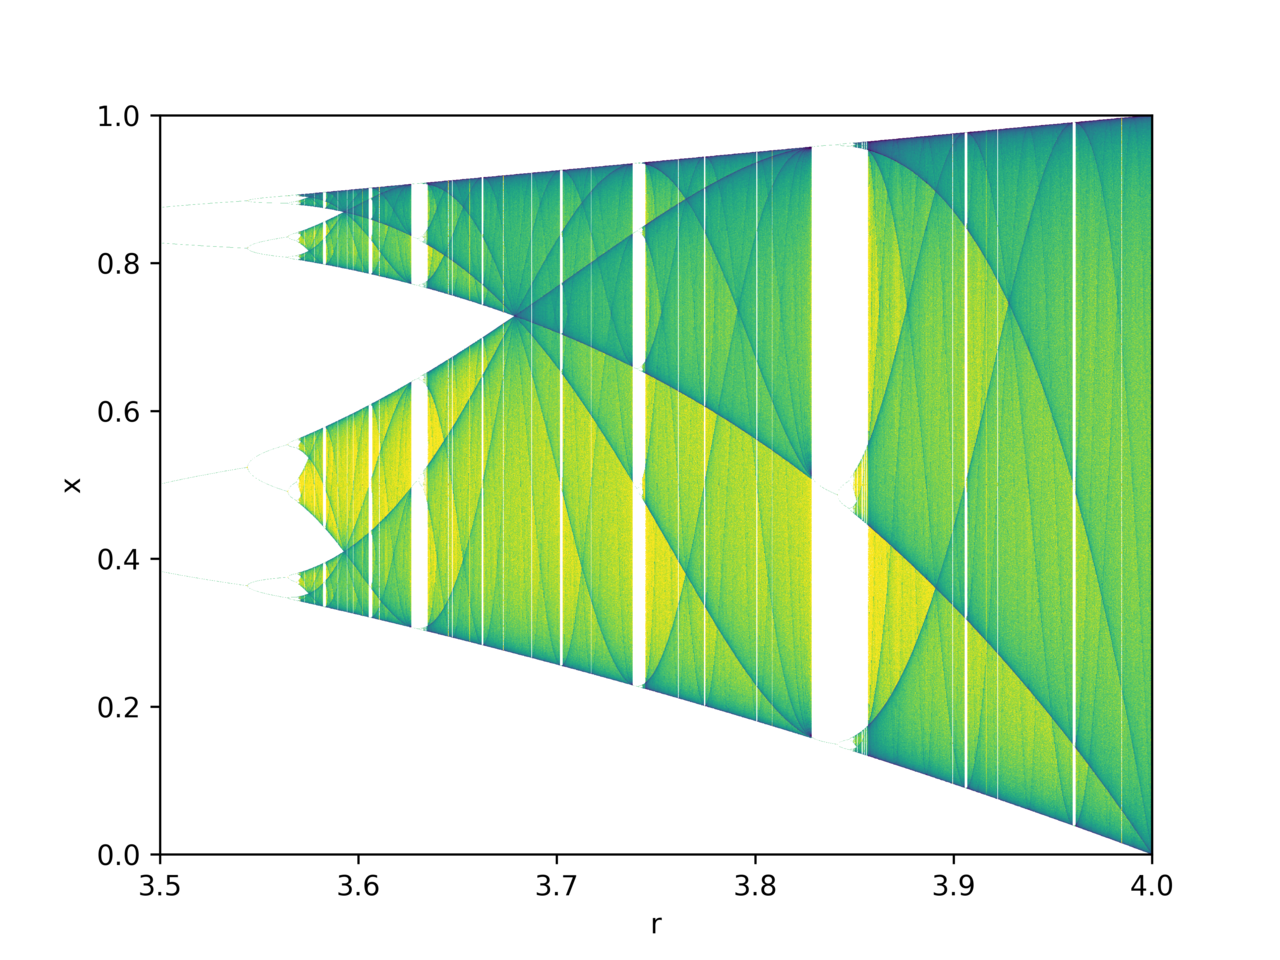
English: A bifurcation diagram for the Logistic map (100,000 iterations). The code is a vectorized version of the scalar code at File:Logistic Map Bifurcation Diagram, Matplotlib.svg which runs much faster but also needs more RAM because iteration results are stored in an array. Iterations are done in batches ("cycles") to lessen RAM demands. |
||
| Date | |||
| Source | Own work | ||
| Author | Morn | ||
| PNG development | This plot was created with Matplotlib. | ||
| Source code | Python code
|
Licensing[edit]
I, the copyright holder of this work, hereby publish it under the following license:
This file is licensed under the Creative Commons Attribution-Share Alike 4.0 International license.
- You are free:
- to share – to copy, distribute and transmit the work
- to remix – to adapt the work
- Under the following conditions:
- attribution – You must give appropriate credit, provide a link to the license, and indicate if changes were made. You may do so in any reasonable manner, but not in any way that suggests the licensor endorses you or your use.
- share alike – If you remix, transform, or build upon the material, you must distribute your contributions under the same or compatible license as the original.
File history
Click on a date/time to view the file as it appeared at that time.
| Date/Time | Thumbnail | Dimensions | User | Comment | |
|---|---|---|---|---|---|
| current | 19:27, 19 January 2019 | | 3,840 × 2,880 (7.34 MB) | Morn (talk | contribs) | use different starting values (looks more smooth) |
| 18:06, 19 January 2019 |  | 3,840 × 2,880 (5.87 MB) | Morn (talk | contribs) | User created page with UploadWizard |
You cannot overwrite this file.
File usage on Commons
There are no pages that use this file.
File usage on other wikis
The following other wikis use this file:
- Usage on en.wikipedia.org