File:Logistic-curve.svg
Jump to navigation
Jump to search

Size of this PNG preview of this SVG file: 600 × 400 pixels. Other resolutions: 320 × 213 pixels | 640 × 427 pixels | 1,024 × 683 pixels | 1,280 × 853 pixels | 2,560 × 1,707 pixels.
Original file (SVG file, nominally 600 × 400 pixels, file size: 3 KB)
Captions
Captions
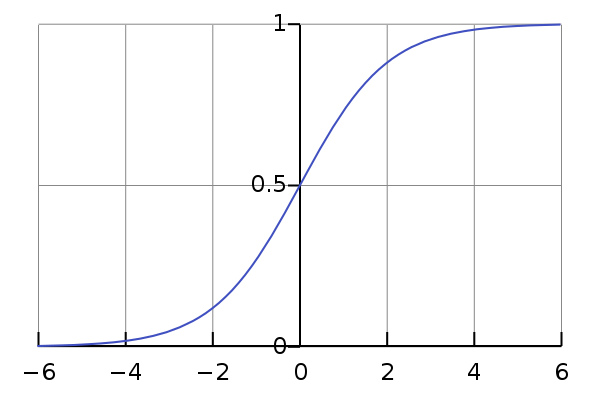
Sigmoid Function Plot / Logistic Curve
Summary[edit]
| Description | The logistic sigmoid function. |
| Date | |
| Source | Created from scratch with gnuplot |
| Author | Qef (talk) |
| Other versions |
|
This vector image was created with a text editor.
Source code[edit]
Created with gnuplot using the following input file:
set terminal svg font "Bitstream Vera Sans,18" size 600,400
set output "Logistic-curve.svg"

set xrange [-6:6]
set xzeroaxis linetype -1
set yzeroaxis linetype -1
set xtics axis nomirror
set ytics axis nomirror 0,0.5,1
set key off
set grid
set border 1

set samples 400

plot exp(x)/(1 + exp(x)) with line linetype rgbcolor "orange" linewidth 2
SVG output filtered with the following command to replace the hyphens with proper minus signs:
sed -i 's/<text>-/<text>\xE2\x88\x92/g' Logistic-curve.svg
Licensing[edit]
| This work has been released into the public domain by its author, Qef. This applies worldwide. In some countries this may not be legally possible; if so: |
File history
Click on a date/time to view the file as it appeared at that time.
| Date/Time | Thumbnail | Dimensions | User | Comment | |
|---|---|---|---|---|---|
| current | 19:32, 4 July 2014 | | 600 × 400 (3 KB) | Aflafla1 (talk | contribs) | size compression, mostly also tik mark emphasis |
| 05:36, 6 April 2012 |  | 600 × 400 (4 KB) | Aflafla1 (talk | contribs) | Compression | |
| 05:50, 2 July 2008 |  | 600 × 400 (12 KB) | Qef (talk | contribs) | Forgot to filter it to use proper minus signs. | |
| 05:40, 2 July 2008 |  | 600 × 400 (12 KB) | Qef (talk | contribs) | {{Information |Description=The logistic sigmoid function. |Source=Created from scratch with gnuplot |Date=2008-07-02 |Author=~~~ |Permission=see below |other_versions=*Bitmap graph of same function, with same axes: Image:Logistic-curve.png }} {{sel |
You cannot overwrite this file.
File usage on Commons
The following 2 pages use this file:
File usage on other wikis
The following other wikis use this file:
- Usage on af.wikipedia.org
- Usage on ar.wikipedia.org
- Usage on az.wikipedia.org
- Usage on ca.wikipedia.org
- Usage on da.wikipedia.org
- Usage on de.wikiversity.org
- Kurs:Mathematik (Osnabrück 2009-2011)/Teil II/Vorlesung 39
- Kurs:Mathematik für Anwender (Osnabrück 2011-2012)/Teil I/Vorlesung 30
- Kurs:Analysis (Osnabrück 2013-2015)/Teil I/Vorlesung 30
- Kurs:Analysis (Osnabrück 2013-2015)/Teil I/Vorlesung 30/kontrolle
- Kurs:Analysis (Osnabrück 2014-2016)/Teil I/Vorlesung 30
- Kurs:Analysis (Osnabrück 2014-2016)/Teil I/Vorlesung 30/kontrolle
- Kurs:Mathematik für Anwender (Osnabrück 2019-2020)/Teil II/Vorlesung 33
- Kurs:Mathematik für Anwender (Osnabrück 2019-2020)/Teil II/Vorlesung 33/kontrolle
- COVID-19/Mathematische Modellierung
- Kurs:Mathematik für Anwender (Osnabrück 2020-2021)/Teil II/Vorlesung 33
- Kurs:Mathematik für Anwender (Osnabrück 2020-2021)/Teil II/Vorlesung 33/kontrolle
- Kurs:Analysis (Osnabrück 2021-2023)/Teil I/Vorlesung 30
- Kurs:Analysis (Osnabrück 2021-2023)/Teil I/Vorlesung 30/kontrolle
- Kurs:Mathematik (Osnabrück 2009-2011)/Teil II/Vorlesung 39/kontrolle
- Kurs:Mathematik für Anwender (Osnabrück 2011-2012)/Teil I/Vorlesung 30/kontrolle
- Usage on el.wikipedia.org
- Usage on en.wikipedia.org
- Usage on en.wikibooks.org
- Usage on en.wikiversity.org
- Usage on en.wiktionary.org
- Usage on es.wikipedia.org
- Usage on eu.wikipedia.org
- Usage on fa.wikipedia.org
- Usage on fi.wikipedia.org
- Usage on fr.wikipedia.org
- Usage on he.wikipedia.org
View more global usage of this file.