File:Lending & Borrowing Decisions - 10 19 08.png

Original file (960 × 720 pixels, file size: 15 KB, MIME type: image/png)
Captions
Captions
Summary[edit]
| Description |
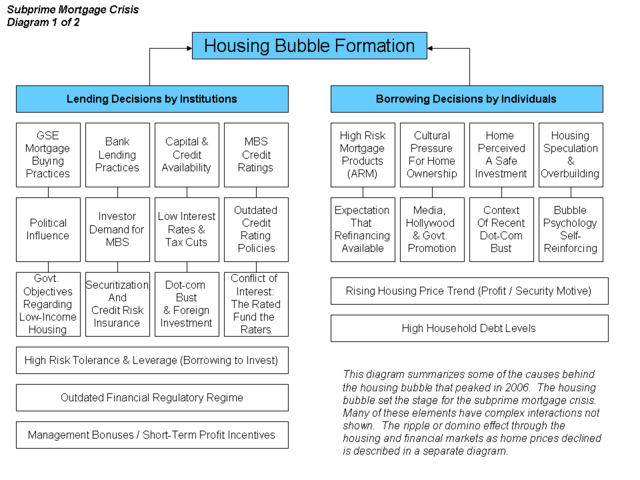
English: Causes of the Housing Bubble OverviewSee the United States housing bubble and subprime mortgage crisis for in-depth discussion and citations. A brief summary of each vertical "string" of causes is included below. While there are many factors that influenced the housing bubble, fundamentally a bubble is built one transaction at a time. Risky lending decisions were made by institutions and risky borrowing decisions were made by both individuals and institutions. According to the Pew Research Center, “There is a broad public consensus regarding the causes of the current problems with financial institutions and markets: 79 percent say people taking on too much debt has contributed a lot to the crisis, while 72 percent say the same about banks making risky loans.”[1] Lending Decisions by Institutions
Borrowing Decisions by Individuals
Transition to the Subprime Mortgage Crisisthumb|A diagram of the elements of the subprime crisis Once housing prices began to fall in June-July 2006, homeowners were often stuck with mortgages they could not afford or refinance. Delinquencies and foreclosures increased dramatically. As mortgage payments fell, the money flowing into MBS decreased during 2007. Many financial institutions suffered enormous losses, with hundreds of mortgage companies and several major financial institutions going bankrupt. Due to uncertainty regarding the financial condition of many financial institutions and banks dramatically increasing lending standards, loanable funds liquidity became less available. This is further described in the second subprime crisis diagram at right. Additional SourcesComprehensive discussions of housing bubbles and the crisis are at: Other Specific contributing causes:
Caveats
SourcesThe letters from Fed Chairman Bernanke provide a helpful explanation of the subject.[4] [5] Further, several cover stories and in-depth articles appeared in the Economist[6] [7] [8] and Business Week.[9] Former Federal Reserve Chairman Greenspan wrote an Op Ed piece for the Wall Street Journal that summarizes the crisis from a variety of angles.[10] Economist Joseph Stiglitz summarized his views on the causes of the crisis.[11] |
| Date | |
| Source | Own work (Original text: I created this work entirely by myself.) |
| Author | Farcaster (talk) 01:39, 20 October 2008 (UTC) |
- ↑ NY Times-
- ↑ AEI-The Destruction of Fannie & Freddie
- ↑ Shiller-Infectious Exuberance-The Atlantic
- ↑ FRB: Speech-Bernanke, Financial Markets, the Economic Outlook, and Monetary Policy -January 10, 2008
- ↑ FRB: Speech-Bernanke, The Recent Financial Turmoil and its Economic and Policy Consequences-October 15, 2007
- ↑ The credit crunch | Postcards from the ledge | Economist.com]
- ↑ CSI: credit crunch | Economist.com]
- ↑ America's economy | Getting worried downtown | Economist.com]
- ↑ Housing Meltdown
- ↑ The Wall Street Journal Online - Featured Article
- ↑ Stiglitz-Capitalist Fools
Licensing[edit]
- You are free:
- to share – to copy, distribute and transmit the work
- to remix – to adapt the work
- Under the following conditions:
- attribution – You must give appropriate credit, provide a link to the license, and indicate if changes were made. You may do so in any reasonable manner, but not in any way that suggests the licensor endorses you or your use.
- share alike – If you remix, transform, or build upon the material, you must distribute your contributions under the same or compatible license as the original.

|
Permission is granted to copy, distribute and/or modify this document under the terms of the GNU Free Documentation License, Version 1.2 or any later version published by the Free Software Foundation; with no Invariant Sections, no Front-Cover Texts, and no Back-Cover Texts. A copy of the license is included in the section entitled GNU Free Documentation License. |
Original upload log[edit]
File history
Click on a date/time to view the file as it appeared at that time.
| Date/Time | Thumbnail | Dimensions | User | Comment | |
|---|---|---|---|---|---|
| current | 00:45, 14 October 2010 | | 960 × 720 (15 KB) | Hideokun (talk | contribs) | {{Information |Description={{en|Causes of the Housing Bubble<br/> ==Overview== See the en:United States housing bubble and en:subprime mortgage crisis for in-depth discussion and citations. A brief summary of each vertical "string" of causes |
You cannot overwrite this file.
File usage on Commons
There are no pages that use this file.
File usage on other wikis
The following other wikis use this file:
- Usage on en.wikipedia.org
- Usage on hi.wikipedia.org
- Usage on ja.wikipedia.org
- Usage on ta.wikipedia.org