File:LLNL US Energy Flow 2009.png
Jump to navigation
Jump to search
Size of this preview: 800 × 533 pixels. Other resolutions: 320 × 213 pixels | 640 × 427 pixels | 1,024 × 683 pixels | 1,280 × 853 pixels | 3,000 × 2,000 pixels.
Original file (3,000 × 2,000 pixels, file size: 489 KB, MIME type: image/png)
Captions
Captions
Add a one-line explanation of what this file represents
Please note: The 2010 version of this chart is available.
Summary[edit]
| Description |
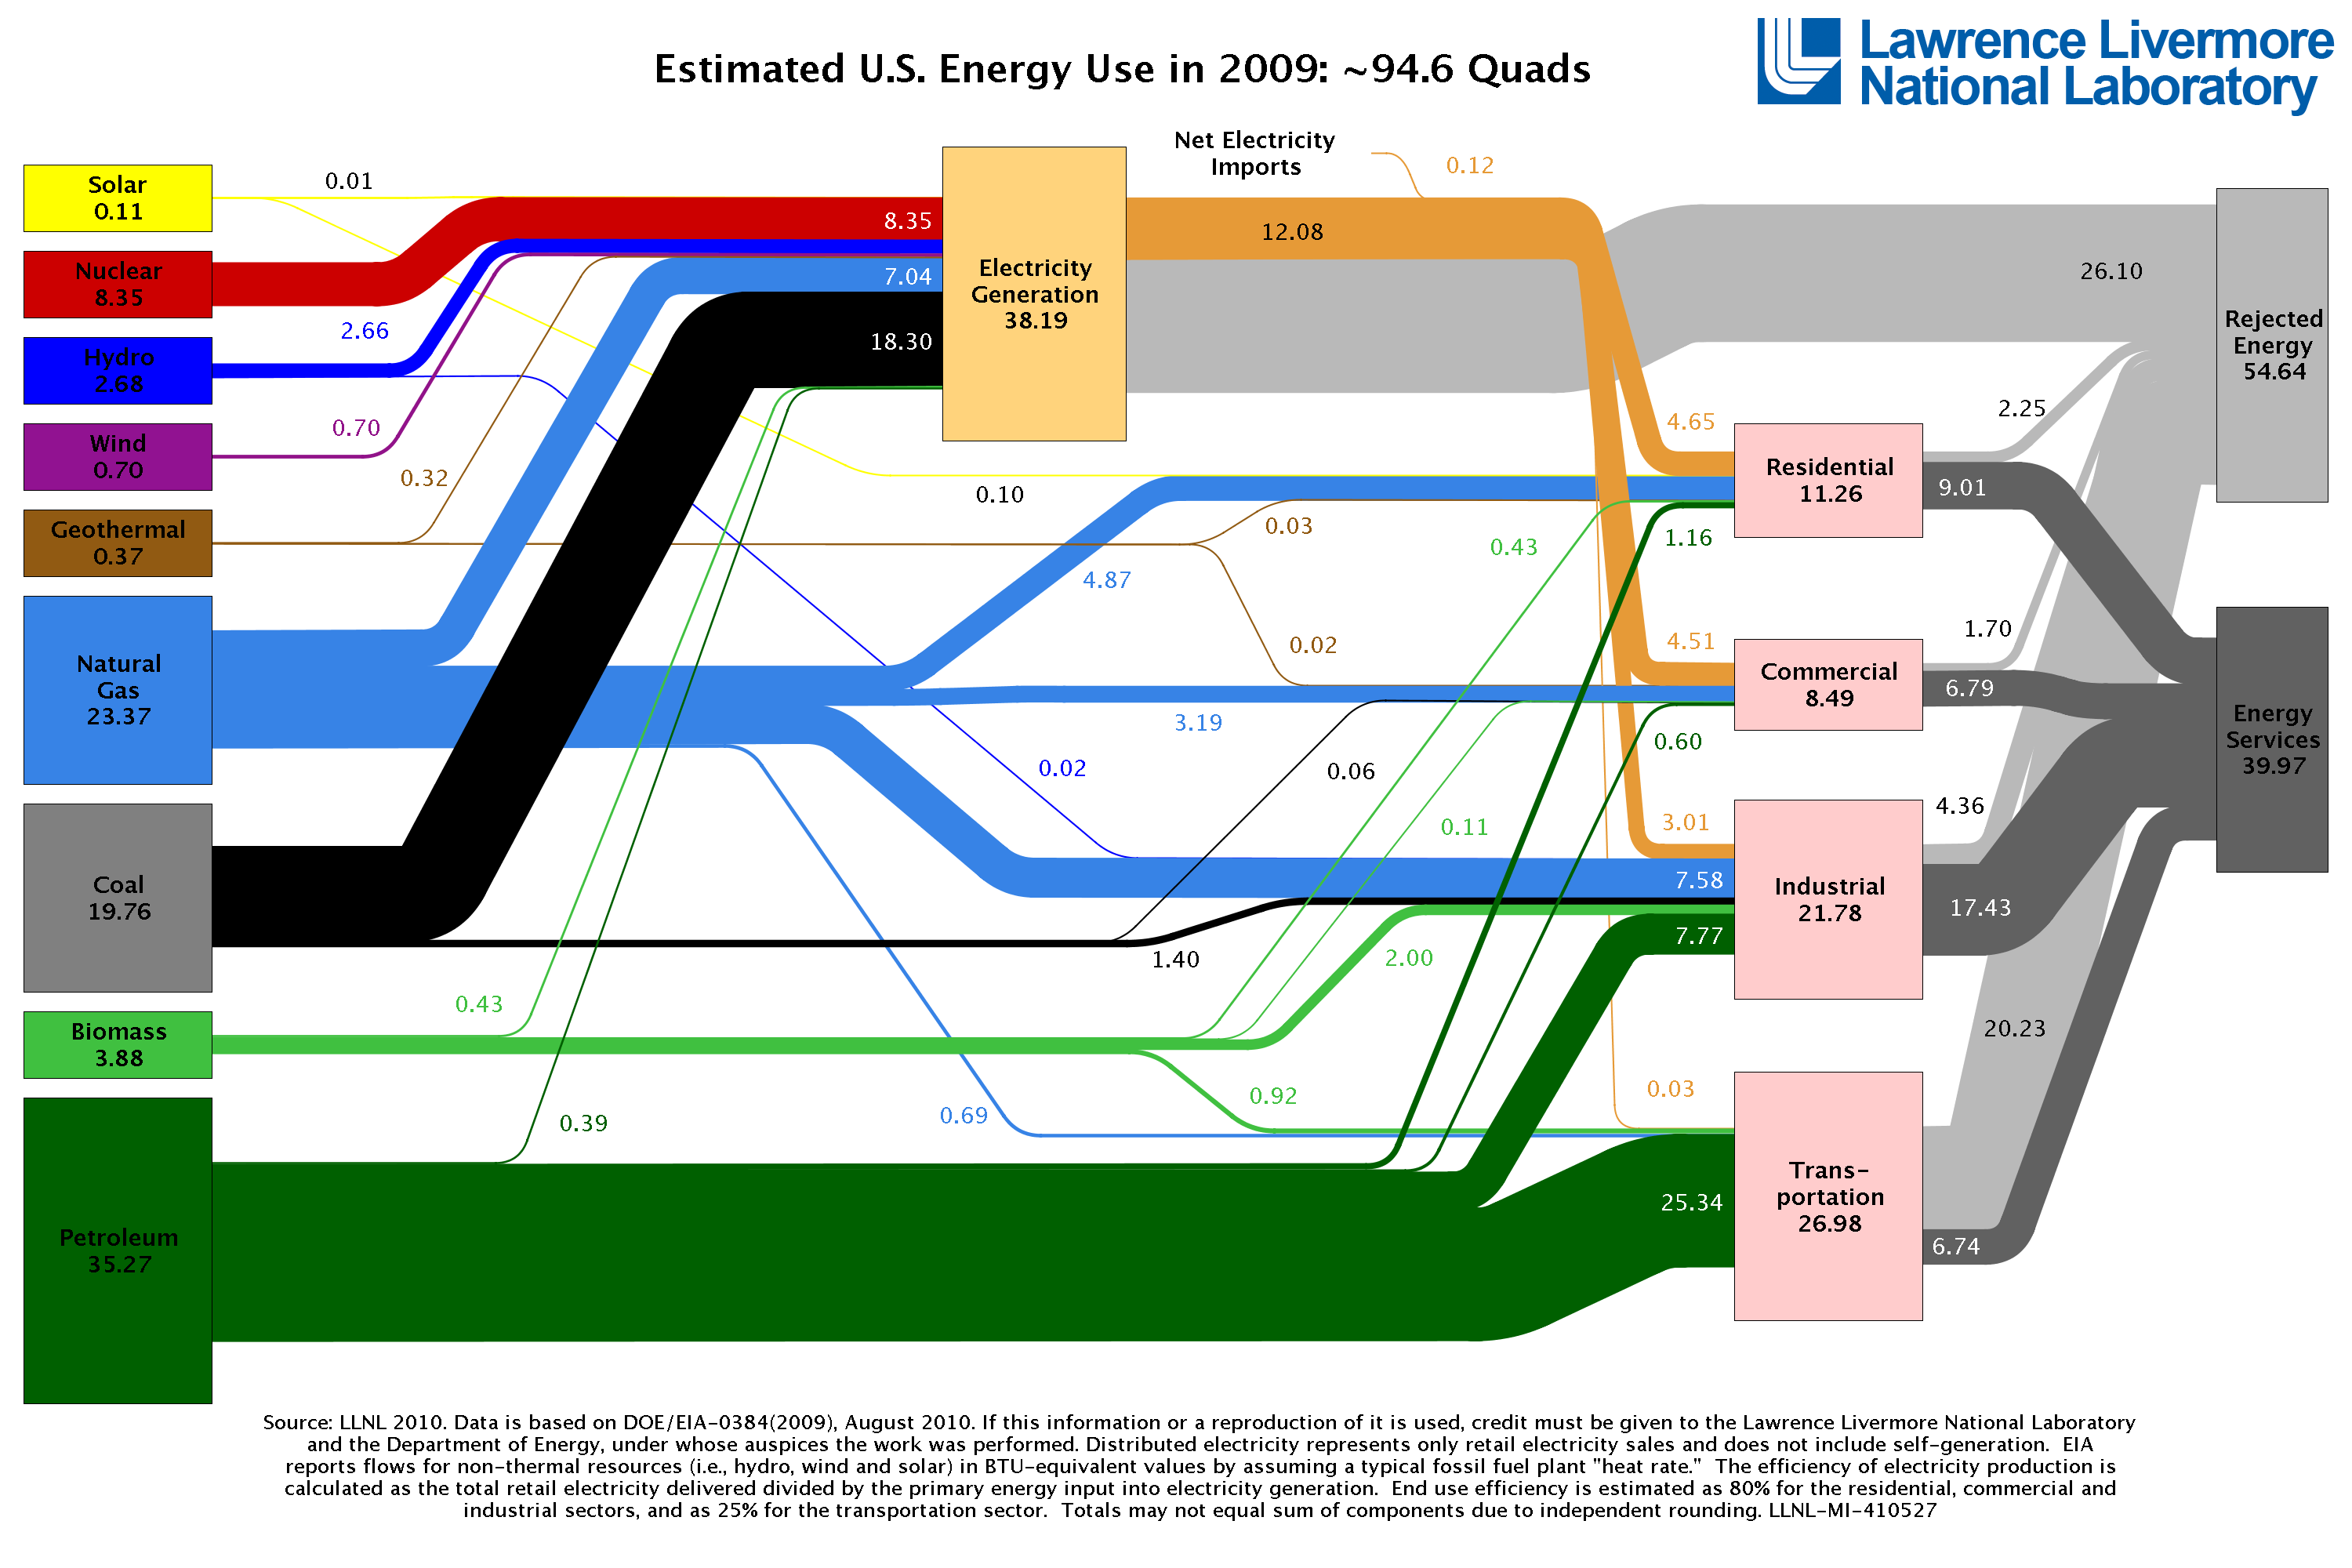
English: Energy flow charts show the relative size of primary energy resources and end uses in the United States, with fuels compared on a common energy unit basis. |
| Date | |
| Source | https://flowcharts.llnl.gov/content/energy/energy_archive/energy_flow_2009/LLNL_US_Energy_Flow_2009.png |
| Author | Lawrence Livermore National Laboratory |
Licensing[edit]
| This image is a work of a United States Department of Energy (or predecessor organization) employee, taken or made as part of that person's official duties. As a work of the U.S. federal government, the image is in the public domain.
Please note that national laboratories operate under varying licences and some are not free. Check the site policies of any national lab before crediting it with this tag.
|

|
File history
Click on a date/time to view the file as it appeared at that time.
| Date/Time | Thumbnail | Dimensions | User | Comment | |
|---|---|---|---|---|---|
| current | 17:43, 5 November 2010 | | 3,000 × 2,000 (489 KB) | Cubic Hour (talk | contribs) | {{Information |Description={{en|1=Energy flow charts show the relative size of primary energy resources and end uses in the United States, with fuels compared on a common energy unit basis. }} |Source=https://flowcharts.llnl.gov/content/energy/energy_arch |
You cannot overwrite this file.
File usage on Commons
There are no pages that use this file.