File:LA beam.png
Jump to navigation
Jump to search
Size of this preview: 800 × 400 pixels. Other resolutions: 320 × 160 pixels | 640 × 320 pixels | 1,500 × 750 pixels.
Original file (1,500 × 750 pixels, file size: 55 KB, MIME type: image/png)
Captions
Captions
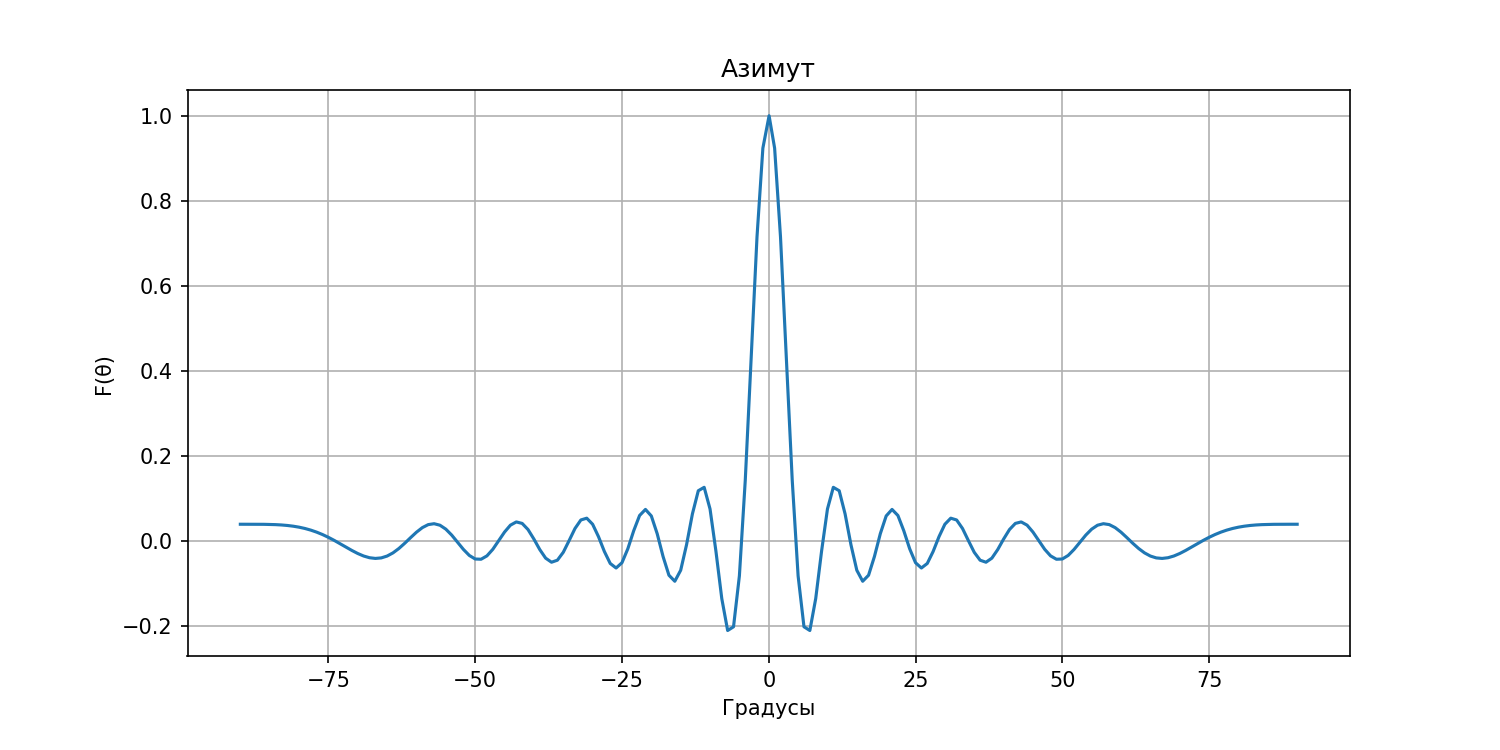
The beam of the linear phased antenna array.
Summary[edit]
| Description |
Русский: Диаграмма направленности для линейной антенной решетки (N=25) 2,4 ГГц |
| Date | |
| Source | Own work |
| Author | Kirlf |
Licensing[edit]
I, the copyright holder of this work, hereby publish it under the following license:
This file is licensed under the Creative Commons Attribution-Share Alike 4.0 International license.
- You are free:
- to share – to copy, distribute and transmit the work
- to remix – to adapt the work
- Under the following conditions:
- attribution – You must give appropriate credit, provide a link to the license, and indicate if changes were made. You may do so in any reasonable manner, but not in any way that suggests the licensor endorses you or your use.
- share alike – If you remix, transform, or build upon the material, you must distribute your contributions under the same or compatible license as the original.
| Description |
Русский: Диаграмма направленности построена в соответствии с Драбкин А., Зузенко В., Кислов А. Антенно-фидерные устройства. - 1974. - с. 399-409 |
| Date | |
| Source | Own work |
| Author | Kirlf |
| PNG development | This plot was created with Matplotlib. |
| Source code | Python codeimport numpy as np
import math
import matplotlib.pyplot as plt
n = 25 # количество элементов АФАР
wavelength = (3e8)/(2.4e9) # длина волны для несущей частоты 2.4 ГГц
d = wavelength / 2
k = 2*np.pi/wavelength
thetaM = 0*(np.pi/180)
thetas = np.arange(-90,91)*(np.pi/180)
for idx, item in enumerate(thetas):
if item == 0:
thetas[idx] = 0.001
F = np.zeros((len(thetas),1))
for idx, theta in enumerate(thetas):
num = np.sin(n*k*d*(np.sin(theta) - np.sin(thetaM))/2)
denum = np.sin(k*d*(np.sin(theta) - np.sin(thetaM))/2)
F[idx] = (1 /n)*(num/denum)
if math.isnan(F[idx]) == True:
F[idx] = 1
plt.figure(figsize=(10, 5), dpi=150)
plt.plot(thetas*(180/np.pi), F)
plt.title("Азимут")
plt.xlabel('Градусы')
plt.ylabel('F(θ)')
plt.grid()
plt.savefig('LA')
|
File history
Click on a date/time to view the file as it appeared at that time.
| Date/Time | Thumbnail | Dimensions | User | Comment | |
|---|---|---|---|---|---|
| current | 08:27, 22 January 2019 | | 1,500 × 750 (55 KB) | Kirlf (talk | contribs) | User created page with UploadWizard |
You cannot overwrite this file.
File usage on Commons
There are no pages that use this file.
File usage on other wikis
The following other wikis use this file:
- Usage on ru.wikipedia.org