File:Kscaleprojections.png
Original file (1,115 × 647 pixels, file size: 23 KB, MIME type: image/png)
Captions
Captions
Summary[edit]
| Description |
Русский: Шкала Кардашева
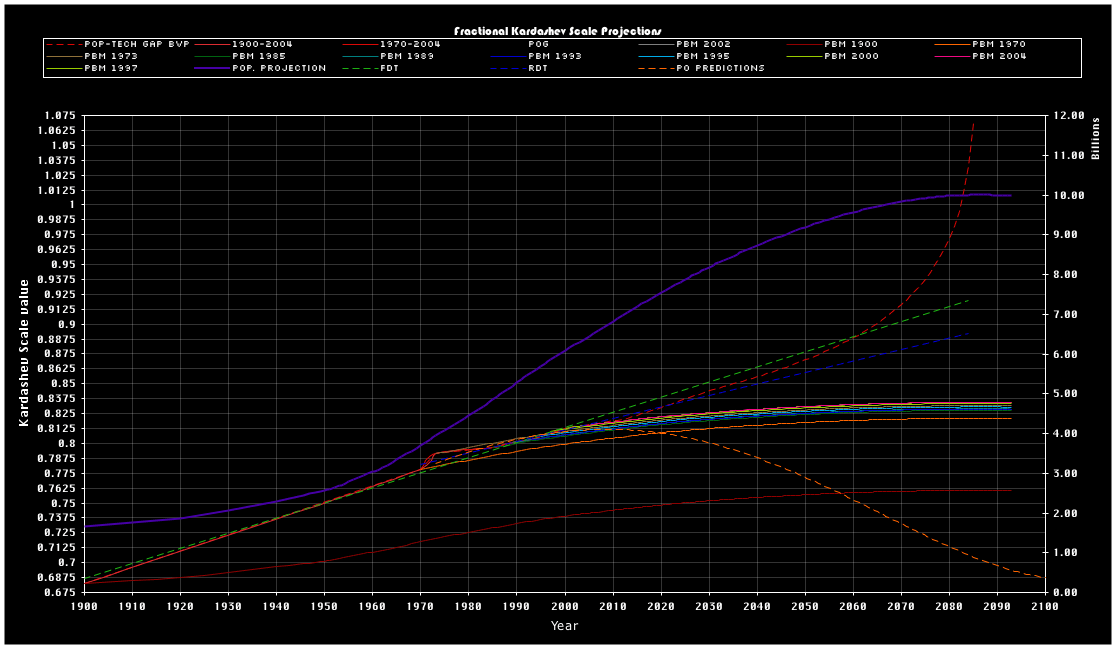
English: An image of Kardashev scale projections ranging from 1900 to 2100. The projections are off by 0.1 on the kardashev scale. This is graphed against the supportable population and given growth against the supposed technology growth associated the kardashev scale. Projections are made by different ratios of energy production to technology growth for a given level of energy (and technology) against predicted population growth, and new technology production and new energy production needed to support a given population, and the growth of such population. In some projections, if energy production is unable to keep up with population growth, technology levels fall. In some projections, as population growth slows, supposedly increased technology can be produced via the lower amount of energy needed to sustain population growth.
Outside comment : It appears much of the data were taken from International Energy Agency, World Energy Outlook 2005, pg. 82, according to User:Sparkygravity. The following is an incomplete legend of lines plotted, with completeness to follow once all original acronyms can be deciphered:
Note that there are no units given for any such plots, though the population projection probably aligns on the right and another user has suggested that the energy "PBM" scales are converted from IEA data on the left. This makes the combination of logarithmic and linear vertical scales, as well as population and energy scales, on the same axis questionable at best, but more likely useless and confusing, and therefore should likely be cleaned up if this image is to retain any usability. Many articles and reproductions online (notably Technological Singularity have vastly misinterpreted this graph in thinking that all lines are Kardashev-scale projections, which has been shown to not be the case. Only the dense cluster of lines are projections relevant to the left-hand Kardashev scale. It is therefore recommended that captions be changed and this image not be used further in any encyclopedia articles for ongoing ambiguity, original research, and confusion in plotting. |
| Date | 7 July 2005 (original upload date) |
| Source | Transferred from en.wikipedia to Commons. |
| Author | Ctrl build at English Wikipedia |
Licensing[edit]

|
Permission is granted to copy, distribute and/or modify this document under the terms of the GNU Free Documentation License, Version 1.2 or any later version published by the Free Software Foundation; with no Invariant Sections, no Front-Cover Texts, and no Back-Cover Texts. A copy of the license is included in the section entitled GNU Free Documentation License. |
| This file is licensed under the Creative Commons Attribution-Share Alike 3.0 Unported license. | ||
| Attribution: Ctrl build at English Wikipedia | ||
| ||
| This licensing tag was added to this file as part of the GFDL licensing update. |
- You are free:
- to share – to copy, distribute and transmit the work
- to remix – to adapt the work
- Under the following conditions:
- attribution – You must give appropriate credit, provide a link to the license, and indicate if changes were made. You may do so in any reasonable manner, but not in any way that suggests the licensor endorses you or your use.
- share alike – If you remix, transform, or build upon the material, you must distribute your contributions under the same or compatible license as the original.
Original upload log[edit]
- 2008-02-01 07:29 Xiong Chiamiov 1115×647× (23395 bytes) optimized using optipng
- 2005-07-07 18:59 Ctrl build 1115×647× (28801 bytes) An image of Kardashev scale projections ranging from 1900 to 2100. The projections are off by 0.1 on the kardashev scale. This is graphed against the supportable population and given growth against the supposed technology growth associated the the kardash
File history
Click on a date/time to view the file as it appeared at that time.
| Date/Time | Thumbnail | Dimensions | User | Comment | |
|---|---|---|---|---|---|
| current | 21:13, 27 June 2012 | | 1,115 × 647 (23 KB) | OgreBot (talk | contribs) | (BOT): Reverting to most recent version before archival |
| 21:13, 27 June 2012 |  | 1,115 × 647 (28 KB) | OgreBot (talk | contribs) | (BOT): Uploading old version of file from en.wikipedia; originally uploaded on 2005-07-07 18:59:33 by Ctrl build | |
| 08:03, 18 February 2012 |  | 1,115 × 647 (23 KB) | BPK (talk | contribs) | {{BotMoveToCommons|ru.wikipedia|year={{subst:CURRENTYEAR}}|month={{subst:CURRENTMONTHNAME}}|day={{subst:CURRENTDAY}}}} The upload bot is User:CommonsHelper2 Bot which is called by [http://toolserver.org/~commonshelper2/index.php CommonsHelper2]. The t |
You cannot overwrite this file.
File usage on Commons
The following page uses this file:
File usage on other wikis
The following other wikis use this file:
- Usage on be.wikipedia.org
- Usage on bg.wikipedia.org
- Usage on en.wikipedia.org
- Usage on tr.wikipedia.org