File:Kindergeld im Vergleich zur Steuerersparnis durch Kinderfreibeträge 2022.svg
Jump to navigation
Jump to search

Size of this PNG preview of this SVG file: 600 × 600 pixels. Other resolutions: 240 × 240 pixels | 480 × 480 pixels | 768 × 768 pixels | 1,024 × 1,024 pixels | 2,048 × 2,048 pixels | 1,260 × 1,260 pixels.
Original file (SVG file, nominally 1,260 × 1,260 pixels, file size: 205 KB)
Captions
Captions
Add a one-line explanation of what this file represents
Summary[edit]
| Description |
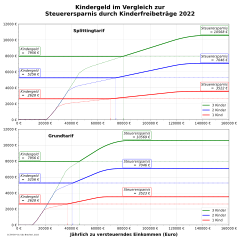
English: Comparison of income tax saving and child benefit in Germany
Deutsch: Steuerersparnis durch Kinderfreibeträge im Vergleich mit dem Kindergeld (Stand 2022) |
| Date | |
| Source | Own work |
| Author | Udo.Brechtel |
| SVG development |
# Python 3.9.2

import numpy as np
import matplotlib as mpl
import matplotlib.pyplot as plt
from matplotlib.ticker import FormatStrFormatter

from est_tarife import ESt
from est_freibetraege import KFB
from kindergeld import kindergeld_pro_jahr as Kg

import locale
# Umstellung auf Deutsch:
locale.setlocale(locale.LC_ALL, 'de_DE.utf8')

# generelle Schrift
font = {'family': 'sans serif',
        'weight': 'normal',
        'style':  'normal',
        'size':   '12'}
mpl.rc('font', **font)
# x/y-Achsen
mpl.rc('xtick', labelsize=14)
mpl.rc('ytick', labelsize=14)

#Steuerersparnis durch Kinderfreibetrag
def EStDiff(zve, vh, n, jahr):
    kfb = n * KFB[jahr]
    ESt0 = ESt(zve, vh, jahr)
    EStK = ESt(zve - kfb, vh, jahr)
    return ESt0 - EStK

def Huellkurve(zve, vh, n, jahr):
    ediff = EStDiff(zve, vh, n, jahr)
    kgeld = Kg(n, jahr)
    if ediff > kgeld:
        return ediff
    else:
        return kgeld

def Grenzwert(zve, vh, n, jahr):
    while Kg(n, jahr)  >= EStDiff(zve, vh, n, jahr):
        zve += 1
    print("Grenzwert", jahr, "n =", n, zve)
    return zve

def plot_kurven(ax, x, vh):
    for n in [3,2,1]:
        ax.plot(x, [EStDiff(zve, vh, n, jahr)    for zve in x], '--', label='', c=farbe[n-1], lw=1.0)
        ax.plot(x, [Kg(n, jahr)                  for zve in x], '--', label='', c=farbe[n-1], lw=1.0)
        ax.plot(x, [Huellkurve(zve, vh, n, jahr) for zve in x], '-',  label=KinderText[n-1],     c=farbe[n-1], lw=2.5)

def set_pfeile(ax, zve_anf, vh, jahr):
    #Pfeile
    spw = 300
    sph = 150
    for n in [1,2,3]:
        y0 = Kg(n, jahr)
        x0 = Grenzwert(zve_anf, vh, n, jahr)
        ax.arrow(x0,y0,0,-y0+sph, head_width=spw, head_length=sph, fc=farbe[n-1], ec=farbe[n-1], lw=0.25)

#Arrays für Plot-Schleife
KinderText = ['1 Kind', '2 Kinder', '3 Kinder']
farbe      = ['red', 'blue', 'green']

def plot_kindergeld_freibetrag(jahr):
    samples = 1000
    xmin  = 0; xmax  = 160000
    y1min = 0; y1max = 12000
    y2min = 0; y2max = 12000

    x = np.arange(xmin, xmax, xmax/samples)

    fig = plt.figure(figsize=(14.0, 14.0), dpi=75)

    fig.suptitle(f'Kindergeld im Vergleich zur\nSteuerersparnis durch Kinderfreibeträge {jahr}', fontsize=24, fontweight='bold')

    ax1 = fig.add_subplot(211) #ZeilenSpaltenPos
    ax1.set_title('Splittingtarif', horizontalalignment='center', x=(5.0/15), y=0.9, fontsize=18, fontweight='bold')

    ax0 = fig.add_subplot(212) #ZeilenSpaltenPos
    ax0.set_title('Grundtarif',     horizontalalignment='center', x=(3.0/15), y=0.9, fontsize=18, fontweight='bold')

    print("plotting 1... Ehepaar")
    plot_kurven(ax1, x, 1)
    ax1.legend(loc='lower right', fontsize=14)

    print("plotting 2... Alleinerziehend")
    plot_kurven(ax0, x, 0)
    ax0.legend(loc='lower right', fontsize=14)

    ax0.set_xlabel('Jährlich zu versteuerndes Einkommen (Euro)', fontsize=18, fontweight='bold', labelpad=10)

    set_texte(ax1, 159000, 1, jahr)
    set_texte(ax0, 100000, 0, jahr)

    set_pfeile(ax1, 69000, 1, jahr)
    set_pfeile(ax0, 36000, 0, jahr)

    basis_settings(ax1, xmin,xmax, y1min,y1max)
    basis_settings(ax0, xmin,xmax, y2min,y2max)


    ax0.text(-9000,-1300, f'CC BY-SA 4.0, Udo Brechtel, {jahr}', fontsize=8, fontweight='normal', color='black')

    plt.tight_layout()
    plt.subplots_adjust(top=0.9)

    plt.savefig(f"bilder/Kindergeld im Vergleich zur Steuerersparnis durch Kinderfreibeträge {jahr}.svg")

def set_texte(ax, zve, vh, jahr):
    dx1, dy1 = 1300, 300
    for n in [1,2,3]:
        kgeld = Kg(n, jahr)
        maxDiff = EStDiff(zve, vh, n, jahr)
        maxDiffText = "Steuerersparnis\n = {0:5.0f} €".format(maxDiff)
        kGeldText = "Kindergeld\n = {0:6.0f} €".format(kgeld)
        ax.text(zve, maxDiff+dy1, maxDiffText, color='black', horizontalalignment='right', fontsize=14, style='italic',
            bbox=dict(facecolor='white', alpha=1.0, edgecolor=farbe[n-1], boxstyle='round,pad=0.3'))
        ax.text(dx1, kgeld+dy1, kGeldText, color='black', horizontalalignment='left', fontsize=14, style='italic',
            bbox=dict(facecolor='white', alpha=1.0, edgecolor=farbe[n-1], boxstyle='round,pad=0.3'))
        print(zve, vh, n, jahr, kGeldText, maxDiffText)

def basis_settings(ax, x0,x1, y0,y1):
    ax.yaxis.set_tick_params(which='both', direction='out', pad=5) #, width=2, colors='black')
    ax.xaxis.set_tick_params(which='both', direction='out', pad=5)
    Euroformat = FormatStrFormatter('%g €')
    ax.xaxis.set_major_formatter(Euroformat)
    ax.yaxis.set_major_formatter(Euroformat)
    ax.grid(b=True, which='major', color='gray', lw=0.4, linestyle='-', alpha=0.6)
    ax.grid(b=True, which='minor', color='gray', lw=0.2, linestyle='-', alpha=0.5)
    ax.minorticks_on()
    ax.yaxis.tick_left()
    ax.xaxis.tick_bottom()
    ax.grid(b=True, which='major', color='gray', lw=0.4, linestyle='-', alpha=0.6)
    ax.grid(b=True, which='minor', color='gray', lw=0.2, linestyle='-', alpha=0.5)
    ax.set_xlim(x0,x1)
    ax.set_ylim(y0,y1)

# RUN:
jahr = 2022
plot_kindergeld_freibetrag(jahr)
Licensing[edit]
I, the copyright holder of this work, hereby publish it under the following license:
This file is licensed under the Creative Commons Attribution-Share Alike 4.0 International license.
- You are free:
- to share – to copy, distribute and transmit the work
- to remix – to adapt the work
- Under the following conditions:
- attribution – You must give appropriate credit, provide a link to the license, and indicate if changes were made. You may do so in any reasonable manner, but not in any way that suggests the licensor endorses you or your use.
- share alike – If you remix, transform, or build upon the material, you must distribute your contributions under the same or compatible license as the original.
File history
Click on a date/time to view the file as it appeared at that time.
| Date/Time | Thumbnail | Dimensions | User | Comment | |
|---|---|---|---|---|---|
| current | 15:52, 27 August 2022 | | 1,260 × 1,260 (205 KB) | Udo.Brechtel (talk | contribs) | {{Information |Description={{en|1=Comparison of income tax saving and child benefit in Germany}} {{de|1=Steuerersparnis durch Kinderfreibeträge im Vergleich mit dem Kindergeld (Stand 2022)}} |Source={{own}} |Date=2022-08-27 |Author= Udo.Brechtel |Permission= |other_versions= }} <source lang=python> # Python 3.9.2 import numpy as np import matplotlib as mpl import matplotlib.pyplot as plt from matplotlib.ticker import FormatStrFormatter from est_tarife import ESt from... |
You cannot overwrite this file.
File usage on Commons
The following page uses this file: