File:KS-Test.png
Jump to navigation
Jump to search

Size of this preview: 800 × 512 pixels. Other resolutions: 320 × 205 pixels | 640 × 410 pixels | 1,024 × 655 pixels | 1,200 × 768 pixels.
Original file (1,200 × 768 pixels, file size: 15 KB, MIME type: image/png)
Captions
Captions
Add a one-line explanation of what this file represents
| Description |
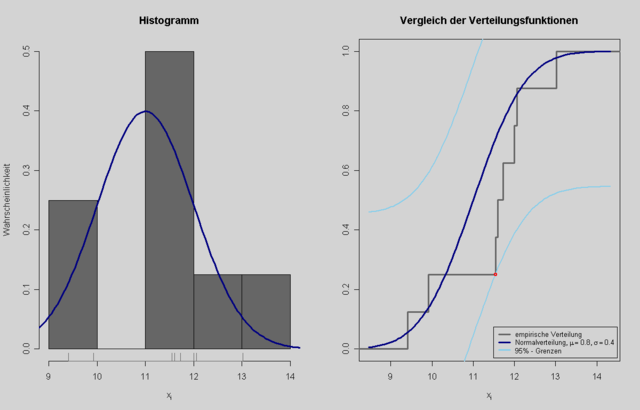
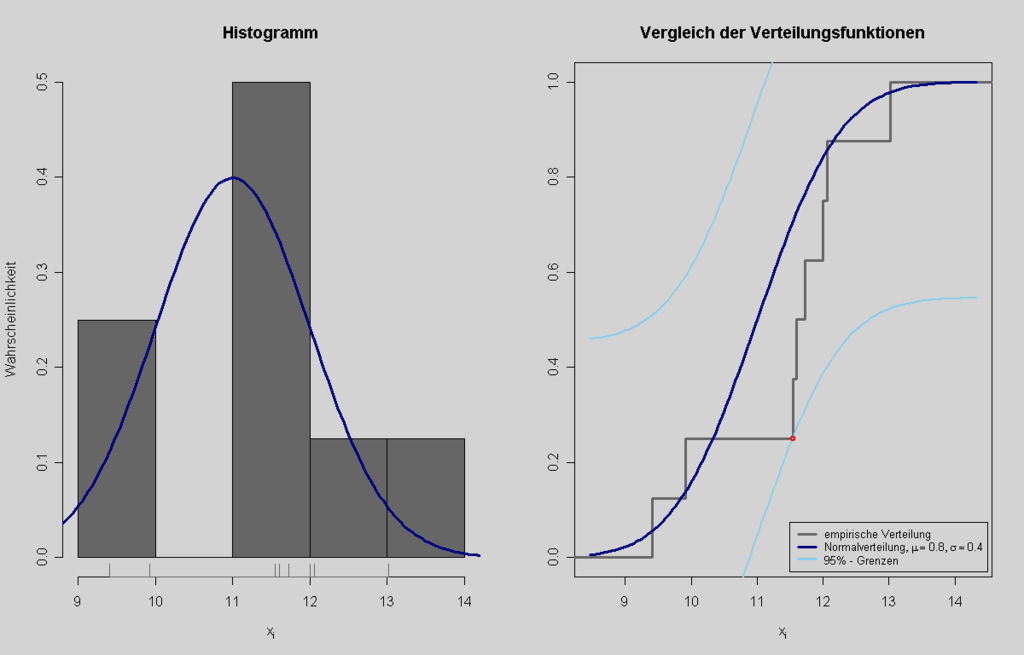
An image for the german example for the kolmogorov smirnov test Deutsch: Grafik zu diesem Zahlenbeispiel. Links ein Histogramm, rechts die tatsächliche und die empirische Verteilungsfunktion |
| Date | |
| Source | created with GNU R, source attached (at the bottom of the page) |
| Author | Thomas Steiner |
| Permission (Reusing this file) |
Thomas Steiner put it under the GFDL |

|
Permission is granted to copy, distribute and/or modify this document under the terms of the GNU Free Documentation License, Version 1.2 or any later version published by the Free Software Foundation; with no Invariant Sections, no Front-Cover Texts, and no Back-Cover Texts. A copy of the license is included in the section entitled GNU Free Documentation License. |
| This file is licensed under the Creative Commons Attribution-Share Alike 3.0 Unported license. | ||
| ||
| This licensing tag was added to this file as part of the GFDL licensing update. |
R Source code[edit]
q<-c(9.41, 9.92, 11.55, 11.60, 11.73, 12.00, 12.06, 13.02)
m=11
s=1
cs=c("grey35","navy","skyblue")
grenze=0.454

png(filename = "KS-Test.png", width=1200, height=768, pointsize=12)
par(mfrow=c(1,2), bg="lightgrey")
hist(q,breaks=4,freq=FALSE,col=cs[1],xlab=expression(x[i]),ylab="Wahrscheinlichkeit",main="Histogramm")
rug(q,col=cs[1],lwd=0.8)

x=seq(min(q)*0.9,max(q)*1.1,length=100)
lines(x,dnorm(x,mean=m,sd=s),col=cs[2],lwd=3)

F0=stepfun(q,c(0,(1:length(q))/length(q)),right=TRUE)
plot(F0,main="Vergleich der Verteilungsfunktionen",do.points=FALSE,col.hor=cs[1],col.vert=cs[1],col.points =cs[1],lwd=3,xlab=expression(x[i]),ylab="",xlim=range(x))
lines(x,pnorm(x,mean=m,sd=s),type="l",col=cs[2],lwd=3)
lines(x,pnorm(x,mean=m,sd=s)-grenze,type="l",col=cs[3],lwd=2)
lines(x,pnorm(x,mean=m,sd=s)+grenze,type="l",col=cs[3],lwd=2)
legend(x="bottomright",inset=0.01,legend=c("empirische Verteilung",expression(list("Normalverteilung",mu == m, sigma == s)),,"95% - Grenzen"),cex=0.8,col=cs,lwd=3)

points(q[3],F0(q[3]), pch=8, col="red", cex=2)
dev.off()
File history
Click on a date/time to view the file as it appeared at that time.
| Date/Time | Thumbnail | Dimensions | User | Comment | |
|---|---|---|---|---|---|
| current | 09:18, 20 March 2006 | | 1,200 × 768 (15 KB) | Thire (talk | contribs) | better colors() |
| 09:05, 20 March 2006 |  | 1,200 × 768 (15 KB) | Thire (talk | contribs) | {{Information| |Description = An image for the german example for the kolmogorov smirnov test |Source = created with GNU R, source attached (at the bottom of the page) |Date = 20 march 2006 |Author = Thomas Steiner |Permission = [[: |
You cannot overwrite this file.
File usage on Commons
There are no pages that use this file.
File usage on other wikis
The following other wikis use this file:
- Usage on de.wikipedia.org
- Usage on de.wikibooks.org
- Usage on hu.wikipedia.org