File:Iceage time 18kyr.png
Jump to navigation
Jump to search

Size of this preview: 800 × 493 pixels. Other resolutions: 320 × 197 pixels | 640 × 394 pixels | 1,026 × 632 pixels.
Original file (1,026 × 632 pixels, file size: 27 KB, MIME type: image/png)
Captions
Captions
Add a one-line explanation of what this file represents
Summary[edit]
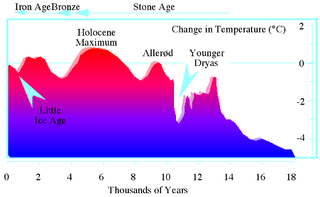
| Description | The prelude, initiation and progression of the current ice age is shown in six different time slices of temperature change (180 Mio yr, 800 kyr, 150 kyr, 18 kyr, 1 kyr, 120 yr). The grey shaded box is the extracted time slice given in the following graf in a higher resolution. Start reading from upper right to upper left: * The decrease in temperature during the last 35 million years is due to changes in ocean current systems controlled by the movement and distribution of the continents (plate tectonic). This long-term cooling is the prelude to the ice age of the Quaternary. * Climate variations (glacial/interglacial cycles) during the ice age of the last 2 Million years are controlled by Milankovitch cycles in the earth orbit around the sun (excentricity, obliquity, precission). * The last glacial/interglacial cycles show a saw tooth shape - with a steep increase in temperature at the termination of a glacial and a slow cooling towards the following glacial. * The last glacial ended at about 18 kyr (21 calendar kiloyears before present), followed by a temperature increase of some degree up to the Holocene climate optimum, interrupted by a short cooling event (Younger Dryas). * The medival warm period is followed by the little ice age presumably caused by changes in the radiation of the sun. * During the last 100 years, a prominent temperature increase starting at the end of the 20th century calls for influence of mankind on climate caused by burning of fossil fuel. Please keep in mind: All grafs are principle scetches and do NOT reflect the most recent knowledge of climate change in detail! Detailed original description: Variations in surface temperature, estimated from a variety of sources, principally isotope ratios from Greenland ice cores, for the last 18,000 years. The onset and subsequent character of the present interglacial or Holocene epoch are depicted. Of note are century-scale oscillations in temperature, identified in the Greenland record and in certain European lakes, during the period of deglaciation between about 15,000 and 10,000 years B.P., and a broad Holocene maximum about 5000-6000 years B.P., when summer temperatures may have been 1-2°C warmer than the present era. At these expanded scales, the temperature excursions depicted in this and the subsequent graph are the most conjectural of the set (modified from J.T. Houghton et aI., Climate Change: The IPCC Assessment, Cambridge University Press, Cambridge, 1990). |
| Date | (UTC) |
| Source | |
| Author |
|
| This is a retouched picture, which means that it has been digitally altered from its original version. Modifications: cut some portion of the file. The original can be viewed here: Iceage time-slice hg.png:
|
Licensing[edit]
This file is licensed under the Creative Commons Attribution 3.0 Unported license.
- You are free:
- to share – to copy, distribute and transmit the work
- to remix – to adapt the work
- Under the following conditions:
- attribution – You must give appropriate credit, provide a link to the license, and indicate if changes were made. You may do so in any reasonable manner, but not in any way that suggests the licensor endorses you or your use.
Original upload log[edit]
This image is a derivative work of the following images:
- File:Iceage_time-slice_hg.png licensed with Cc-by-3.0
- 2006-07-21T23:05:58Z Hgrobe 3208x2074 (153178 Bytes) {{Information| |Description= |Source=own work |Date=2000-04-07 |Author=~~~~ |Permission=Own work, share alike, attribution required (Creative Commons CC-BY-SA-2.5) |other_versions= }} {{self|cc-by-sa-2.5}} [[Category:Geolog
Uploaded with derivativeFX
File history
Click on a date/time to view the file as it appeared at that time.
| Date/Time | Thumbnail | Dimensions | User | Comment | |
|---|---|---|---|---|---|
| current | 11:02, 22 October 2011 | | 1,026 × 632 (27 KB) | Alexchris (talk | contribs) | == {{int:filedesc}} == {{Information |Description=The prelude, initiation and progression of the current '''ice age''' is shown in six different time slices of temperature change (180 Mio yr, 800 kyr, 150 kyr, 18 kyr, 1 kyr, 120 yr). The grey shaded box i |
You cannot overwrite this file.
File usage on Commons
There are no pages that use this file.
File usage on other wikis
The following other wikis use this file:
- Usage on bs.wikipedia.org
- Usage on ca.wikipedia.org
- Usage on en.wikipedia.org
- Usage on la.wikipedia.org