File:Hydrogen Density Plots.png
Jump to navigation
Jump to search

Size of this preview: 660 × 600 pixels. Other resolutions: 264 × 240 pixels | 528 × 480 pixels | 845 × 768 pixels | 1,126 × 1,024 pixels | 2,200 × 2,000 pixels.
Original file (2,200 × 2,000 pixels, file size: 1.79 MB, MIME type: image/png)
Captions
Captions
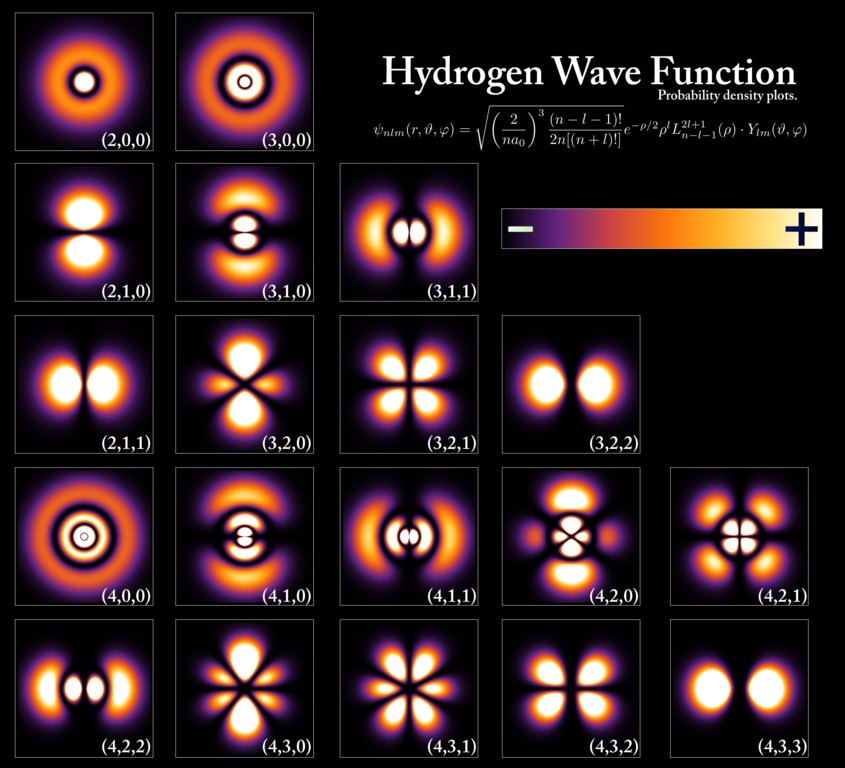
Hydrogen Density Plots. Wavefunctions of the electron in a hydrogen atom at different energy levels. The brighter areas represent a higher probability of finding the electron.
Summary[edit]
| Description |
English: Hydrogen density plots for n up to 4.
Wavefunctions of the electron in a hydrogen atom at different energy levels. Quantum mechanics cannot predict the exact location of a particle in space, only the probability of finding it at different locations. The brighter areas represent a higher probability of finding the electron. |
||
| Date | |||
| Source |
the English language Wikipedia (log).
|
||
| Author | PoorLeno (talk) | ||
| Permission (Reusing this file) |
|
||
| Other versions |
Derivative works of this file: |


File history
Click on a date/time to view the file as it appeared at that time.
| Date/Time | Thumbnail | Dimensions | User | Comment | |
|---|---|---|---|---|---|
| current | 17:46, 12 May 2017 | | 2,200 × 2,000 (1.79 MB) | AkanoToE (talk | contribs) | Cleaned up the LaTeX wavefunction formula to be less rasterized. |
| 10:09, 3 February 2009 |  | 2,200 × 2,000 (1.58 MB) | Ashik (talk | contribs) | == Summary == {{Information |Description=Hydrogen Density Plots for n up to 4. |Source=I created this work entirely by myself. |Date=17 August 2008 |Author=PoorLeno (talk) |other_versions= }} {{PD-self}} <!-- |
You cannot overwrite this file.
File usage on Commons
The following 10 pages use this file:
File usage on other wikis
The following other wikis use this file:
- Usage on az.wikipedia.org
- Usage on bcl.wikipedia.org
- Usage on be.wikipedia.org
- Usage on bh.wikipedia.org
- Usage on bn.wikipedia.org
- Usage on bs.wikipedia.org
- Usage on ckb.wikipedia.org
- Usage on de.wikipedia.org
- Usage on de.wikibooks.org
- Usage on el.wikipedia.org
- Usage on el.wiktionary.org
- Usage on en.wikipedia.org
- Atomic orbital
- Electron
- Talk:Hydrogen atom
- Nature
- Quantum mechanics
- Energy level
- Schrödinger equation
- Wave function
- User:Patrick0Moran
- Portal:Physics
- User:PoorLeno
- Theoretical and experimental justification for the Schrödinger equation
- Talk:Quantum mechanics/Archive 7
- Talk:Hydrogen/Archive 1
- Talk:Electron/Archive 3
- User talk:Sean.hoyland/Archive 1
- Quantum state
- User:Siva.tecz/sandbox
- Talk:Wave function/Archive 5
- User:Chickstarr404/Gather lists/13561 – The origins of Knowledge and Imagination by J. Bronowski
- Wikipedia:Reference desk/Archives/Science/2016 May 10
- User:Armanaziz/Nature
- Wikipedia:VideoWiki/C. V. Raman
- Wikipedia:Featured picture candidates/Hydrogen wave function
- Wikipedia:Featured picture candidates/March-2021
- User:Patcha007
- Usage on en.wikiquote.org
- Usage on en.wikiversity.org
- Usage on es.wikipedia.org
View more global usage of this file.