File:Greenhouse Effect eu.png
Jump to navigation
Jump to search

Size of this preview: 800 × 596 pixels. Other resolutions: 320 × 238 pixels | 640 × 476 pixels | 1,024 × 762 pixels | 1,280 × 953 pixels | 1,628 × 1,212 pixels.
Original file (1,628 × 1,212 pixels, file size: 43 KB, MIME type: image/png)
Captions
Captions
Add a one-line explanation of what this file represents

|
This diagram image could be re-created using vector graphics as an SVG file. This has several advantages; see Commons:Media for cleanup for more information. If an SVG form of this image is available, please upload it and afterwards replace this template with
{{vector version available|new image name}}.
It is recommended to name the SVG file “Greenhouse Effect eu.svg”—then the template Vector version available (or Vva) does not need the new image name parameter. |
Summary[edit]
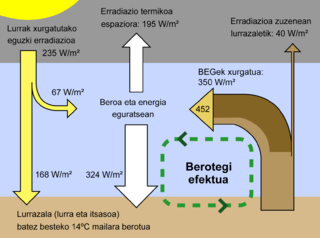
| Description | This figure is a simplified, schematic representation of the flows of energy between space, the atmosphere, and the Earth's surface, and shows how these flows combine to trap heat near the surface and create the greenhouse effect. Energy exchanges are expressed in watts per square meter (W/m2) and derived from Kiehl & Trenberth (1997). | ||||||||
| Date | |||||||||
| Source | Image:Greenhouse Effect.svg, translated in Basque. | ||||||||
| Author | Created by Robert A. Rohde and translated in Basque by Josugoni | ||||||||
| Permission (Reusing this file) |
This figure was created by Robert A. Rohde from published data and is part of the Global Warming Art project. Image from Global Warming Art
This image is an original work created for Global Warming Art. Please refer to the image description page for more information.
|
||||||||
| Other versions |
[]
|


File history
Click on a date/time to view the file as it appeared at that time.
| Date/Time | Thumbnail | Dimensions | User | Comment | |
|---|---|---|---|---|---|
| current | 22:49, 29 February 2016 | | 1,628 × 1,212 (43 KB) | Cmdrjameson (talk | contribs) | Compressed with pngout. Reduced by 86kB (66% decrease). |
| 21:50, 10 May 2008 |  | 1,628 × 1,212 (129 KB) | Josugoni (talk | contribs) | ||
| 21:48, 10 May 2008 |  | 1,721 × 1,357 (140 KB) | Josugoni (talk | contribs) | {{Information |Description= This figure is a simplified, schematic representation of the flows of energy between space, the atmosphere, and the Earth's surface, and shows how these flows combine to trap heat near the surface and create the greenhouse |
You cannot overwrite this file.
File usage on Commons
The following 33 pages use this file:
- File:Drivhuseffekt.png
- File:Efecto invernadero.PNG
- File:Efeito estufa.PNG
- File:Efekt cieplarniany schemat 01.svg
- File:Efekt cieplarniany schemat 02.png
- File:Effet de Serre.png
- File:Effet de serre.svg
- File:Greenhouse Effect-bn.svg
- File:Greenhouse Effect-ca.svg
- File:Greenhouse Effect-cs.svg
- File:Greenhouse Effect-fi.png
- File:Greenhouse Effect-gu.svg
- File:Greenhouse Effect-hi.svg
- File:Greenhouse Effect-kn.svg
- File:Greenhouse Effect-no.svg
- File:Greenhouse Effect-ta.svg
- File:Greenhouse Effect-te.svg
- File:Greenhouse Effect.png
- File:Greenhouse Effect.svg
- File:Greenhouse Effect ar.svg
- File:Greenhouse Effect as.svg
- File:Greenhouse Effect el.svg
- File:Greenhouse Effect eo.svg
- File:Greenhouse Effect eu.png
- File:Greenhouse Effect id.png
- File:Greenhouse Effect ja.png
- File:Greenhouse Effect mk.svg
- File:Greenhouse Effect nl.svg
- File:Greenhouse Effect rev es.svg
- File:Greenhouse Effect uk.svg
- File:Greenhouse Effect vn.png
- File:Greenhouse Effect zh-hans.svg
- Template:Other versions/Greenhouse Effect
File usage on other wikis
The following other wikis use this file:
- Usage on eu.wikipedia.org