File:Greenhouse Effect-da.svg
Jump to navigation
Jump to search

Size of this PNG preview of this SVG file: 750 × 577 pixels. Other resolutions: 312 × 240 pixels | 624 × 480 pixels | 998 × 768 pixels | 1,280 × 985 pixels | 2,560 × 1,969 pixels.
Original file (SVG file, nominally 750 × 577 pixels, file size: 21 KB)
Captions
Captions
Add a one-line explanation of what this file represents
Summary[edit]
| Description |
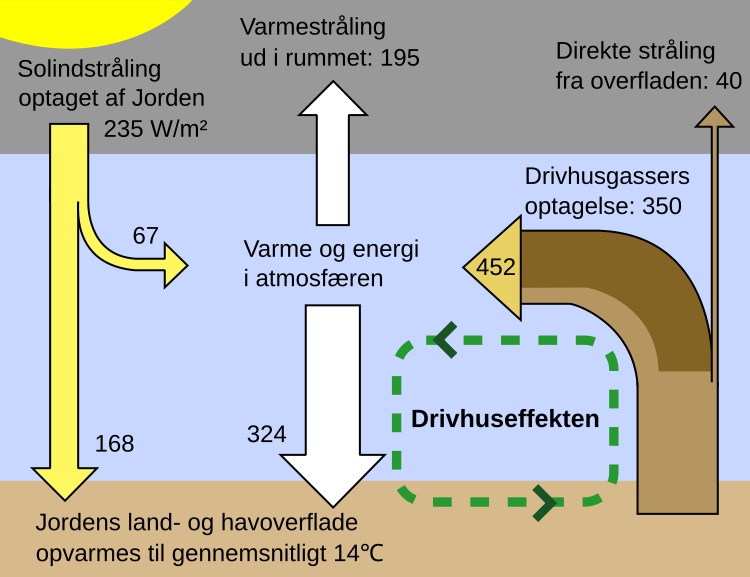
English: This figure is a simplified, schematic representation of the flows of energy between space, the atmosphere, and the Earth's surface, and shows how these flows combine to trap heat near the surface and create the greenhouse effect. Energy exchanges are expressed in watts per square meter (W/m2) and derived from Kiehl & Trenberth (1997). Complete figure: (http://www.cgd.ucar.edu/cas/abstracts/files/kevin1997_1.html UCAR.edu) Suggested corrections: * Change the 195 from "thermal radiation" to "atmospheric radiation" into space, as it does not include the 40 radiated from the surface. * Change the "Greenhouse gas absorption: 350" to "Surface radiation absorbed/ captured by greenhouse gas: 350" or "Athmospheric absorption of surface radiation: 350" or "Greenhouse gas radiation absorption: 350" (see the Kiehl/Trenberth source). If this is not feasible due to space limitations it should possibly be explained in the image notes that the remaining grey part of the arrow stands for thermic energy transmission by convection of sensible and latent heat.) The sun is responsible for virtually all energy that reaches the Earth's surface. Direct overhead sunlight at the top of the atmosphere provides 1366 W/m2; however, geometric effects and reflective surfaces limit the light which is absorbed at the typical location to an annual average of ~235 W/m2. If this were the total heat received at the surface, then, neglecting changes in albedo, the Earth's surface would be expected to have an average temperature of -18 °C (Lashof 1989). Of the surface heat captured by the atmosphere, more than 75% can be attributed to the action of greenhouse gases that absorb thermal radiation emitted by the Earth's surface. The atmosphere in turn transfers the energy it receives both into space (38%) and back to the Earth's surface (62%), where the amount transferred in each direction depends on the thermal and density structure of the atmosphere. This process by which energy is recycled in the atmosphere to warm the Earth's surface is known as the greenhouse effect and is an essential piece of Earth's climate. Under stable conditions, the total amount of energy entering the system from solar radiation will exactly balance the amount being radiated into space, thus allowing the Earth to maintain a constant average temperature over time. However, recent measurements indicate that the Earth is presently absorbing 0.85 ± 0.15 W/m2 more than it emits into space (Hansen et al. 2005). An overwhelming majority of climate scientists believe that this asymmetry in the flow of energy has been significantly increased by human emissions of greenhouse gases [1]. This figure was created by Robert A. Rohde from published data and is part of the Global Warming Art project. |
| Date | (UTC) |
| Source |
This file was derived from: Greenhouse Effect.svg:  |
| Author |
|
| This is a retouched picture, which means that it has been digitally altered from its original version. The original can be viewed here: Greenhouse Effect.svg:
|
Licensing[edit]
I, the copyright holder of this work, hereby publish it under the following license:

|
Permission is granted to copy, distribute and/or modify this document under the terms of the GNU Free Documentation License, Version 1.2 only as published by the Free Software Foundation; with no Invariant Sections, no Front-Cover Texts, and no Back-Cover Texts. A copy of the license is included in the section entitled GNU Free Documentation License. | 1.2 only |
Original upload log[edit]
This image is a derivative work of the following images:
- File:Greenhouse Effect.svg licensed with GFDL-1.2
- 2020-04-09T17:42:31Z Efbrazil 750x577 (21415 Bytes) Minor edit, improving alignment of text with larger font for thumbnail view
- 2020-03-30T17:06:50Z Efbrazil 750x577 (21426 Bytes) Improved fonts and alignment for thumbnail legibility
- 2007-10-25T15:00:21Z Rugby471 750x577 (21535 Bytes) changed width
- 2007-10-02T17:42:30Z Rugby471 750x577 (20305 Bytes) == Description == {{en|This figure is a simplified, schematic representation of the flows of [[energy]] between [[space]], the [[Earth's atmosphere|atmosphere]], and the Earth's surface, and shows how these flows combine to t
Uploaded with derivativeFX
File history
Click on a date/time to view the file as it appeared at that time.
| Date/Time | Thumbnail | Dimensions | User | Comment | |
|---|---|---|---|---|---|
| current | 18:51, 25 April 2020 | | 750 × 577 (21 KB) | Brinchj (talk | contribs) | == {{int:filedesc}} == {{Information |Description={{en|This figure is a simplified, schematic representation of the flows of energy between space, the atmosphere, and the Earth's surface, and shows how these flows combine to trap heat near the surface and create the greenhouse effect. Energy exchanges are expressed in watts per square meter (W/m<sup>2</sup>) and derived from Kiehl & Trenberth... |
You cannot overwrite this file.
File usage on Commons
There are no pages that use this file.
File usage on other wikis
The following other wikis use this file:
- Usage on da.wikipedia.org