File:Gleisanschlüsse-Diagramm.svg
Jump to navigation
Jump to search

Size of this PNG preview of this SVG file: 800 × 600 pixels. Other resolutions: 320 × 240 pixels | 640 × 480 pixels | 1,024 × 768 pixels | 1,280 × 960 pixels | 2,560 × 1,920 pixels.
Original file (SVG file, nominally 800 × 600 pixels, file size: 34 KB)
Captions
Captions
Add a one-line explanation of what this file represents
Summary[edit]
| Description |
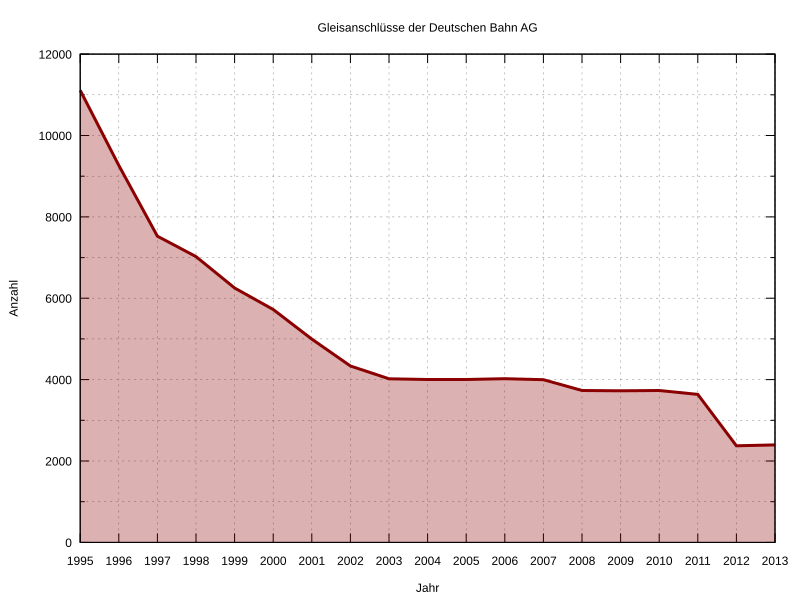
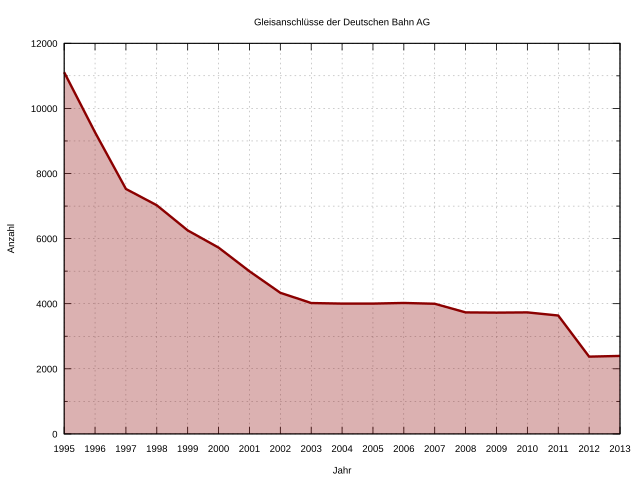
Deutsch: Gleisanschlüsse der Deutschen Bahn AG, Entwicklung von 1995 bis 2011 |
| Date | |
| Source | Daten: Bundesministerium für Verkehr, Bau und Stadtentwicklung (Hrsg.): Verkehr in Zahlen 2013/2014. DVV Media Group, Hamburg 2013, ISBN 978-3-87154-493-4, S. 52f. |
| Author | EveryPicture; Teile des Quelltexts: Simified |
| Permission (Reusing this file) |
I, the copyright holder of this work, hereby publish it under the following license: This file is licensed under the Creative Commons Attribution-Share Alike 3.0 Unported license.
|
| SVG development | |
| Source code | Gnuplot code# Erstellt von EveryPicture mit Gnuplot Online, http://gnuplot.respawned.com/
# Lizenz: CC-BY-SA 3.0 unported, https://creativecommons.org/licenses/by-sa/3.0/deed.de
# Basierend auf http://commons.wikimedia.org/wiki/File:Bayreuth_Bevoelkerungsentwicklung.svg von Michael Fiedler <michael.fiedler87@gmx.de>
set title 'Gleisanschlüsse der Deutschen Bahn AG'
unset key
set style fill transparent solid 0.3
set grid xtics ytics mytics
set xlabel 'Jahr'
# Definitionsbereich
set xrange [1995:2011]
# Einteilung der x-Achse
set xtics 1
set ylabel 'Anzahl'
# Wertebereich
set yrange [0:12000]
# Einteilung der y-Achse
set ytics 2000
set mytics 2
set format y '%.0f'
set terminal svg size 800,600 font 'Arial,10'
set output 'Ausgabedatei.svg'
Data# '-' nimmt die nachfolgenden Daten als Eingabewerte
plot '-' using 1:($2) with filledcurves below x1 linetype rgb 'dark-red' linewidth 3
# Datenquelle: Bundesministerium für Verkehr, Bau und Stadtentwicklung (Hrsg.): Verkehr in Zahlen 2013/2014.
1995 11111
1996 9264
1997 7524
1998 7024
1999 6252
2000 5724
2001 4997
2002 4336
2003 4020
2004 4004
2005 4004
2006 4023
2007 3998
2008 3732
2009 3726
2010 3732
2011 3638
e
|
File history
Click on a date/time to view the file as it appeared at that time.
| Date/Time | Thumbnail | Dimensions | User | Comment | |
|---|---|---|---|---|---|
| current | 10:09, 21 June 2015 | | 800 × 600 (34 KB) | Kopiersperre (talk | contribs) | Verkehr in Zahlen 2014/2015 |
| 23:18, 22 January 2015 |  | 800 × 600 (20 KB) | EveryPicture (talk | contribs) |
You cannot overwrite this file.
File usage on Commons
The following 2 pages use this file:
File usage on other wikis
The following other wikis use this file:
- Usage on de.wikipedia.org