File:Fpls-02-00033-g002.png
Jump to navigation
Jump to search
Size of this preview: 657 × 599 pixels. Other resolutions: 263 × 240 pixels | 526 × 480 pixels | 842 × 768 pixels | 1,123 × 1,024 pixels | 2,246 × 2,048 pixels | 2,837 × 2,587 pixels.
Original file (2,837 × 2,587 pixels, file size: 169 KB, MIME type: image/png)
Captions
Captions
Add a one-line explanation of what this file represents
Summary[edit]
| Description |
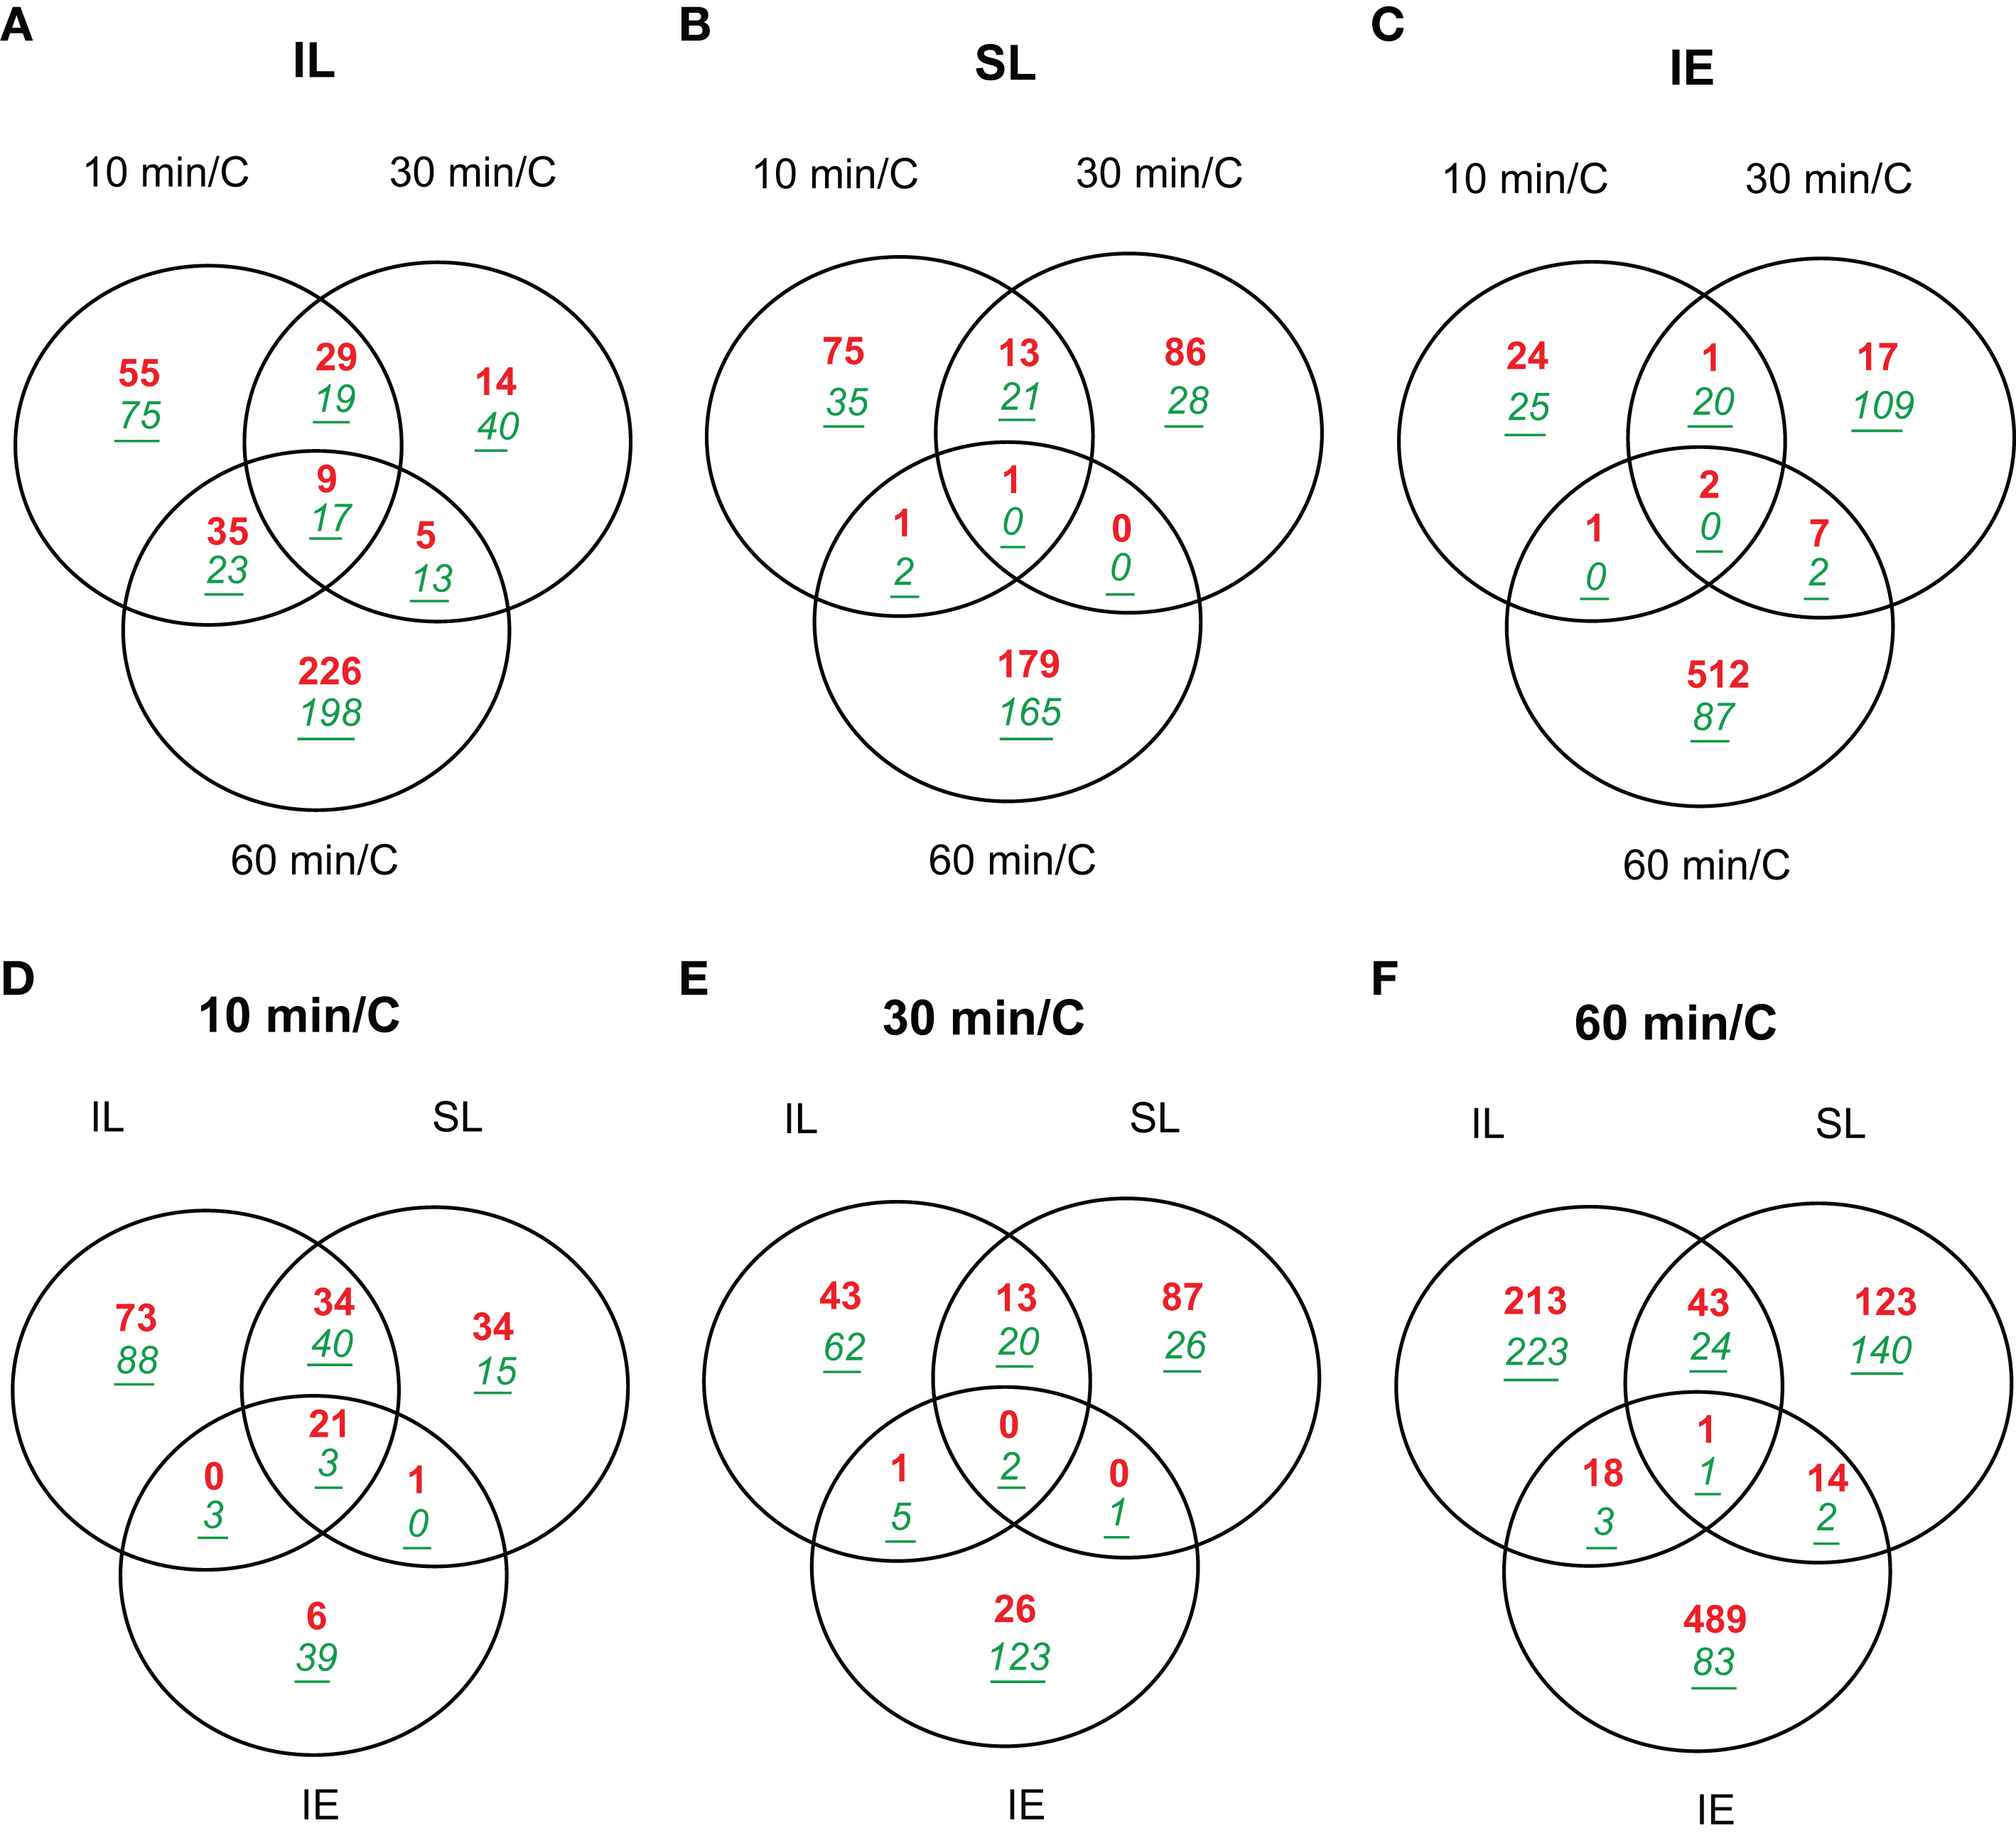
English: Venn diagrams comparing transcriptome changes in leaves and immature ears from UV-B-irradiated plants in only two adult leaves compared to non-irradiated control plants (C). Plants were irradiated over a time course of 10, 30, and 60 min. Intersection of genes differentially expressed in irradiated leaves (A); shielded leaves (B); and immature ears (C) during 10, 30, and 60 min. Intersection of genes differentially expressed after 10 min (D); 30 min (E); and 60 min (F) in IL, SL, and IE. Transcripts showing changes higher than two-fold (p < 0.05) were included in the classification. Up-regulated transcripts are in red (bold), down-regulated transcripts are in green (italics, underlined). |
| Date | |
| Source | doi:10.3389/fpls.2011.00033 |
| Author | Paula Casati, Darren J. Morrow, John F. Fernandes, Virginia Walbot |
Licensing[edit]
This file is licensed under the Creative Commons Attribution 3.0 Unported license.
- You are free:
- to share – to copy, distribute and transmit the work
- to remix – to adapt the work
- Under the following conditions:
- attribution – You must give appropriate credit, provide a link to the license, and indicate if changes were made. You may do so in any reasonable manner, but not in any way that suggests the licensor endorses you or your use.
File history
Click on a date/time to view the file as it appeared at that time.
| Date/Time | Thumbnail | Dimensions | User | Comment | |
|---|---|---|---|---|---|
| current | 08:48, 6 June 2017 | | 2,837 × 2,587 (169 KB) | TIB-NOA (talk | contribs) | pattypan 17.05 |
You cannot overwrite this file.
File usage on Commons
The following page uses this file: