File:Elasticnetreg.png
Jump to navigation
Jump to search

Size of this preview: 800 × 596 pixels. Other resolutions: 320 × 239 pixels | 640 × 477 pixels | 1,024 × 763 pixels | 1,280 × 954 pixels | 1,686 × 1,257 pixels.
Original file (1,686 × 1,257 pixels, file size: 196 KB, MIME type: image/png)
Captions
Captions
Add a one-line explanation of what this file represents
Summary[edit]
| Description |
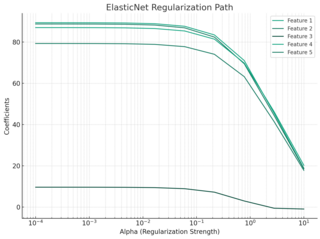
English: The plot illustrates the ElasticNet regularization path for a regression problem with five features. As the regularization strength (alpha) increases, the magnitude of the feature coefficients diminishes. ElasticNet, combining L1 and L2 regularization, allows some coefficients to become exactly zero, while others shrink towards zero but remain non-zero. The log-scaled x-axis represents the strength of regularization, and the y-axis denotes the magnitude of the coefficients for each feature. |
| Date | |
| Source | Own work |
| Author | Chamaemelum |
Licensing[edit]
| This chart is ineligible for copyright and therefore in the public domain, because it consists entirely of information that is common property and contains no original authorship. For more information, see Commons:Threshold of originality § Charts
|

|
This media file is uncategorized.
Please help improve this media file by adding it to one or more categories, so it may be associated with related media files (how?), and so that it can be more easily found.
Please notify the uploader with {{subst:Please link images|File:Elasticnetreg.png}} ~~~~ |
File history
Click on a date/time to view the file as it appeared at that time.
| Date/Time | Thumbnail | Dimensions | User | Comment | |
|---|---|---|---|---|---|
| current | 00:30, 23 August 2023 | | 1,686 × 1,257 (196 KB) | Chamaemelum (talk | contribs) | Uploaded own work with UploadWizard |
You cannot overwrite this file.
File usage on Commons
There are no pages that use this file.