File:Economics Gini coefficient.svg

Original file (SVG file, nominally 500 × 500 pixels, file size: 3 KB)
Captions
Captions
Summary[edit]
| Description |
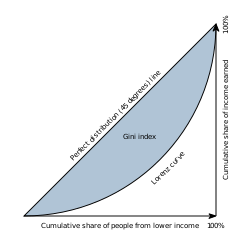
English: Gini coefficient diagram You can think of the horizontal axis as percent of people and the vertical axis as the percent of income those people receive. Therefore the curves always start and end at the same places, where 0% of people make 0% of the country's income and 100% of people making 100% of the total income. The disparity comes in at the left hand side of the curve where the percent of people is higher than the percent of income they receive (i.e. 10% of the people getting 5% of the total income). And at the right hand side when the percent of income received rises more than the percent of people receiving it. |
| Date | |
| Source | en:File:Economics Gini coefficient.png by Bluemoose |
| Author | BenFrantzDale at en.wikipedia |
| Other versions |
 |
Licensing[edit]
The depicted text is ineligible for copyright and therefore in the public domain because it is not a “literary work” or other protected type in sense of the local copyright law. Facts, data, and unoriginal information which is common property without sufficiently creative authorship in a general typeface or basic handwriting, and simple geometric shapes are not protected by copyright.
This tag does not generally apply to all images of texts. Particular countries can have different legal definition of the “literary work” as the subject of copyright and different courts' interpretation practices. Some countries protect almost every written work, while other countries protect distinctively artistic or scientific texts and databases only. Extent of creativeness, function and length of the text can be relevant. The copyright protection can be limited to the literary form – the included information itself can be excluded from protection.
|
Original upload log[edit]
- 2007-11-03 17:05 BenFrantzDale 500×500×??? (3387 bytes) Same image, sharper arrows, less vivid shading.
File history
Click on a date/time to view the file as it appeared at that time.
| Date/Time | Thumbnail | Dimensions | User | Comment | |
|---|---|---|---|---|---|
| current | 18:02, 6 March 2021 | | 500 × 500 (3 KB) | Nyq (talk | contribs) | decapitalized common nouns |
| 00:22, 9 September 2008 |  | 500 × 500 (3 KB) | File Upload Bot (Magnus Manske) (talk | contribs) | {{BotMoveToCommons|en.wikipedia}} {{Information |Description={{en|Gini coefficient diagram, based on the version by Bluemoose You can think of the horizontal axis as percent of people |
You cannot overwrite this file.
File usage on Commons
The following page uses this file:
File usage on other wikis
The following other wikis use this file:
- Usage on bn.wikipedia.org
- Usage on he.wikipedia.org
- Usage on ig.wikipedia.org
- Usage on ko.wikipedia.org
- Usage on lv.wikipedia.org
- Usage on mk.wikipedia.org
- Usage on no.wikipedia.org
- Usage on sl.wikipedia.org
- Usage on uz.wikipedia.org