File:Diagramme pvt PP semi cristallin modele Tait.svg
Jump to navigation
Jump to search

Size of this PNG preview of this SVG file: 513 × 399 pixels. Other resolutions: 309 × 240 pixels | 617 × 480 pixels | 988 × 768 pixels | 1,280 × 996 pixels | 2,560 × 1,991 pixels.
Original file (SVG file, nominally 513 × 399 pixels, file size: 168 KB)
Captions
Captions
Add a one-line explanation of what this file represents
Summary[edit]
| Description |
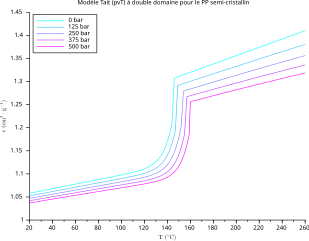
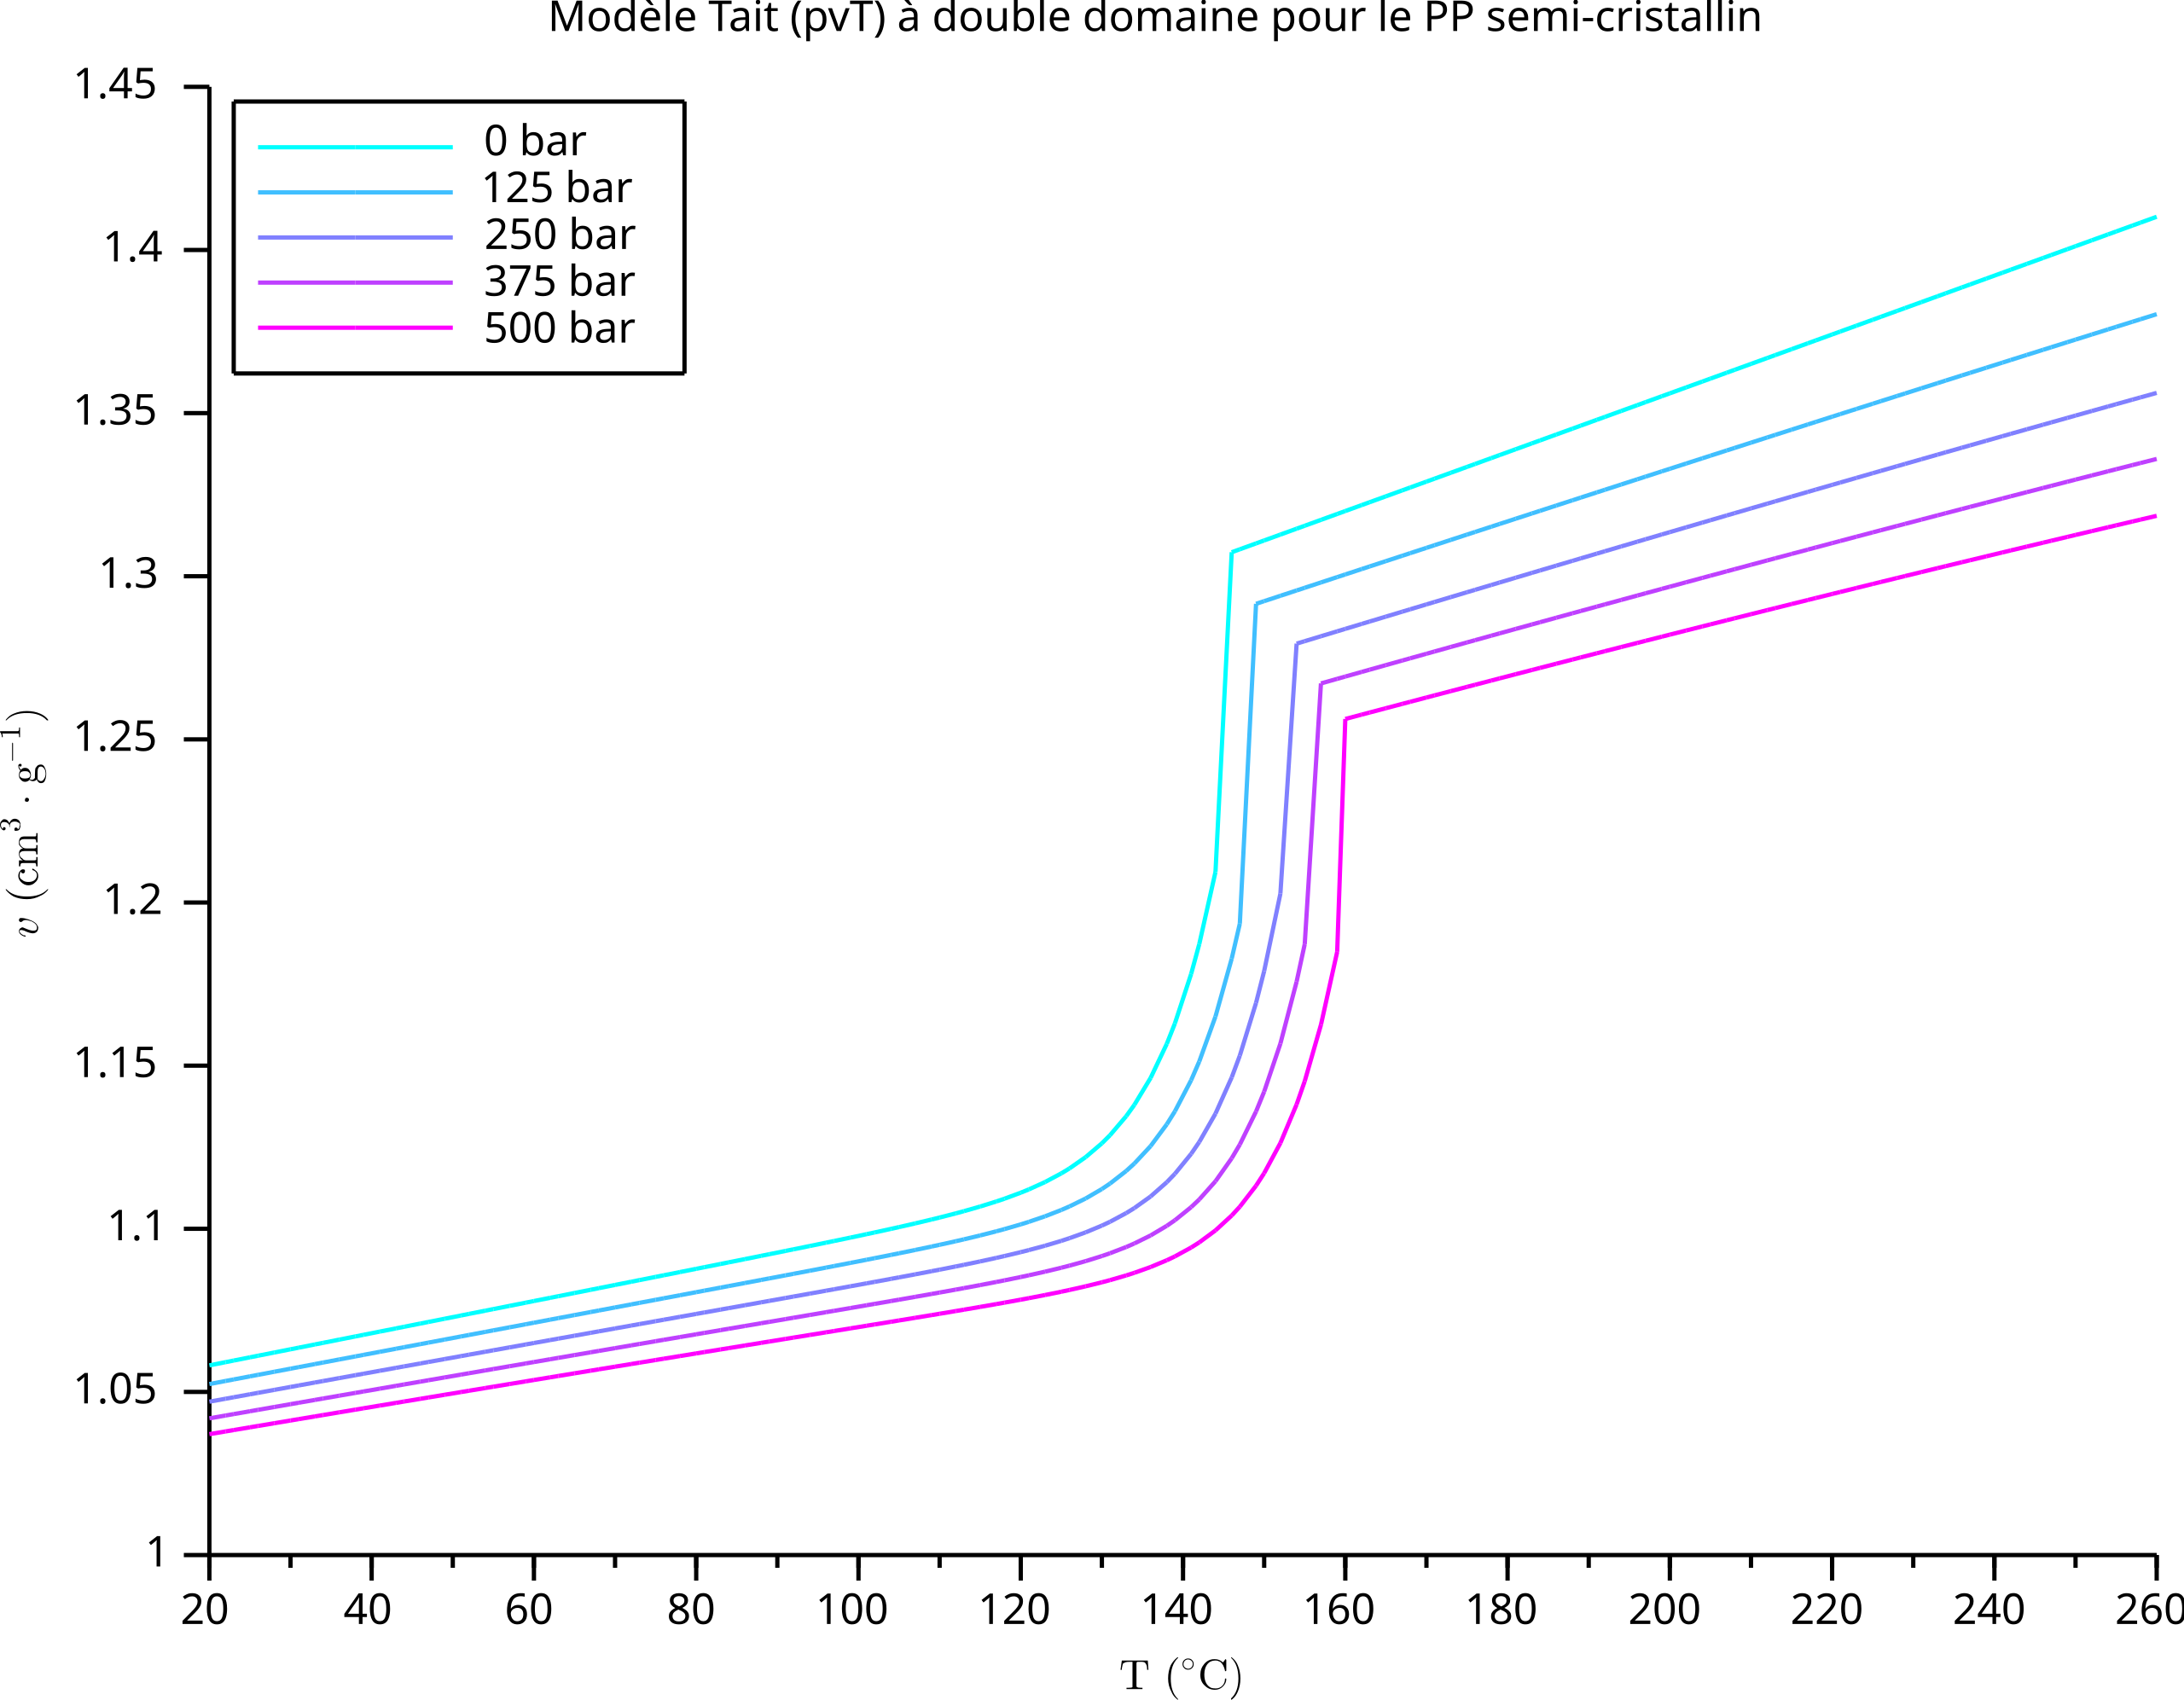
Français : Diagramme pvT d'un polypropylène semi-cristallin selon le modèle Tait à double domaine. English: pvT diagram for a semicrystalline polypropylene according to the Tait two-domain model. |
||||||||||||||||
| Date | |||||||||||||||||
| Source |
Own work, data from
|
||||||||||||||||
| Author | Cdang | ||||||||||||||||
Scilab source
 |
This media was created with Scilab, a free open-source software. Here is a listing of the Scilab source used to create this file. |
//============================================================================
// nom : courbes_pvT_PP.sce
// auteur : Christophe Dang Ngoc Chan
// date de création : 2013-07-08
// dates de modification :
//    2013-07-09 : pressions en bar, étendu à 500 bar
//    2013-07-10 : calcul du coefficient de dilatation
//----------------------------------------------------------------------------
// version de Scilab : 5.4.1
// module Atoms requis : aucun
//----------------------------------------------------------------------------
// Objectif : trace un faisceau de courbes v = f(p)
//   pour des températures données
// Entrées : aucune (codé en dur)
// Sorties : fenêtre graphique
//============================================================================

// ********** Initialisation **********

clear;

// ********** Constantes **********

// masse volumique CNPT
rho = 9; // kg/m^3

// modèle Tait à double domaine (uSI)
// m = molten (fondu) ; s = solide
b1m = 1.306e-3; // m3.kg-1
b2m = 9.019e-7; // m3.kg-1.K-1
b3m = 7.43e7; // Pa
b4m = 4.006e-3; // K-1
b1s = 1.1195e-3; // m3.kg-1
b2s = 4.929e-7; // m3.kg-1.K-1
b3s = 1.319e8; // Pa
b4s = 3.355e-3; // K-1
b5 = 417.64; // K
b6 = 3.0225e-7; // K.Pa-1
b7 = 9.623e-5; // m3.kg-1
b8 = 1.338e-1; // K-1
b9 = 3.973e-8; // Pa-1
C = 0.0894;

// abscisse
Npoints = 240; // nombre de courbes
Tcelsius = round(linspace(20, 260, Npoints)); // °C
T = Tcelsius + 273.15; // K

// gamme de pression
Npress = 5; // nombre de faisceaux
pbar = 0.1*round(10*linspace(0, 500, Npress)); // bar
p = 1e5*pbar; // Pa

// carte de couleur
cmap=coolcolormap(Npress);
xset("colormap", cmap);


// ********** Fonctions **********

function  [tetoile]=Tetoile(b5, t)
    // Objectif : calcule T* du modèle Tait
    // entrées : paramètre b5 (scalaire réel),
    //    t (matrice réelle)
    // sorties : matrice réelle
    tetoile = t - b5;
endfunction


function [Tt]=temperature_transition(b5, b6, p)
    // Objectif : calcule Tt du modèle Tait
    // entrée : paramètres b5, b6 (scalaires réels),
    //    p (matrice réelle)
    // sortie : Tt (matrice réelle)
    Tt = b5 + b6*p;
endfunction


function [v0]=vol_spec_0(b1m, b1s, b2m, b2s, Tt, t, tetoile)
    // objectif : calculer le volume spécifique à pression 0 du modèle Tait
    // entrées : paramètres b1m, b1s, b2m, b2s, Tt (scalaires réels)
    //   T, T* (matrices réelles)
    indice = (t <= Tt);
    v0(indice) = b1s + b2s*tetoile(indice);
    v0(~indice) = b1m + b2m*tetoile(~indice);
endfunction


function [B]=sensibilite_pression(b3m, b3s, b4m, b4s, Tt, t, tetoile)
    // objectif : calculer la sensibilité à la pression B du modèle Tait
    // entrées : paramètres b3m, b3s, b4m, b4s, Tt (scalaires réels)
    //   T, T* (matrices réelles)
    indice = (t <= Tt);
    B(indice) = b3s*exp(-b4s*tetoile(indice));
    B(~indice) = b3m*exp(-b4m*tetoile(~indice));
endfunction


function [v]=vt(b7, b8, b9, Tt, p, t, tetoile)
    // objectif : calculer vt du modèle Tait
    // entrées : paramètres b7, b8, b9, Tt, p (scalaires réels)
    //   T, T* (matrices réelles)
    indice = (t <= Tt);
    v(indice) = b7*exp(b8*tetoile(indice) - b9*p);
    v(~indice) = 0;
endfunction


function [v]=vol_spec(T, b1m, b2m, b3m, b4m, b1s, b2s, b3s, b4s,...
    b5, b6, b7, b8, b9, C, p)
    // objectif : calculer le volume spécifique du modèle Tait
    // entrées : paramètres b1*, ..., b9, C, p (scalaires réels)
    //    températures T (matrice de réels)
    // sorties : volumes spécifiques v (matrice de réels)
    tetoile = Tetoile(b5, T);
    Tt = temperature_transition(b5, b6, p);
    v0 = vol_spec_0(b1m, b1s, b2m, b2s, Tt, T, tetoile);
    B = sensibilite_pression(b3m, b3s, b4m, b4s, Tt, T, tetoile);
    v_t = vt(b7, b8, b9, Tt, p, T, tetoile);
    v = v0.*(1 - C*log(1 + p./B)) + v_t;
endfunction


// ********** Programme principal **********

scf(0); clf;
xtitle("Modèle Tait (pvT) à double domaine pour le PP semi-cristallin",...
    "$\mathrm{T}\ (°\mathrm{C})$", "$v\ (\mathrm{cm}^3\cdot\mathrm{g}^{-1})$");

volume_specifique = zeros(Npress, Npoints); // initialisation

for P = 1:Npress // faisceaux
    v = vol_spec(T, b1m, b2m, b3m, b4m, b1s, b2s, b3s, b4s,...
    b5, b6, b7, b8, b9, C, p(P));
    volume_specifique(P, :) = v;
    plot2d(Tcelsius, 1000*v);
    h = gce();
    h.children.foreground=P;
end
legend(string(pbar(1))+" bar", string(pbar(2))+" bar", ...
    string(pbar(3))+" bar", string(pbar(4))+" bar", ...
    string(pbar(5))+" bar", 2)
xpoly([T(1), T($)], [1.1, 1.1])

scf(1); clf;
xtitle("Coefficient de dilatation volumique isobare (modèle Tait)",...
    "$\mathrm{T}\ (°\mathrm{C})$", ...
    "$\beta\ (10^{-6}\mathrm{K}^{-1})$");

coef_dilat = zeros(Npress, Npoints-2); // initialisation
beta_d = zeros(1, Npoints-2);
for P = 1:Npress // faisceaux
    for i=2:Npoints-1
        beta_d(i-1) = (volume_specifique(P, i+1) - volume_specifique(P, i-1))...
        /((T(i+1) - T(i - 1))*volume_specifique(P, i));
    end
    plot2d(Tcelsius(2:$-1), 1e6*beta_d');
    h = gce();
    h.children.foreground=P;
    h.parent.data_bounds(2, 2) = 2000;
end
legend(string(pbar(1))+" bar", string(pbar(2))+" bar", ...
    string(pbar(3))+" bar", string(pbar(4))+" bar", ...
    string(pbar(5))+" bar", 2)
Licensing[edit]
I, the copyright holder of this work, hereby publish it under the following license:
| This file is made available under the Creative Commons CC0 1.0 Universal Public Domain Dedication. | |
| The person who associated a work with this deed has dedicated the work to the public domain by waiving all of their rights to the work worldwide under copyright law, including all related and neighboring rights, to the extent allowed by law. You can copy, modify, distribute and perform the work, even for commercial purposes, all without asking permission.
|
File history
Click on a date/time to view the file as it appeared at that time.
| Date/Time | Thumbnail | Dimensions | User | Comment | |
|---|---|---|---|---|---|
| current | 09:55, 9 July 2013 | | 513 × 399 (168 KB) | Cdang (talk | contribs) | pressure in bar instead of MPa ; range extended to 500 bar (50 MPa). |
| 09:04, 9 July 2013 |  | 513 × 398 (166 KB) | Cdang (talk | contribs) | User created page with UploadWizard |
You cannot overwrite this file.
File usage on Commons
The following page uses this file:
File usage on other wikis
The following other wikis use this file:
- Usage on fr.wikipedia.org