File:Diagramm, Veränderungen der Inflationsrate und der Arbeitslosenquote.png
Jump to navigation
Jump to search

Size of this preview: 800 × 495 pixels. Other resolutions: 320 × 198 pixels | 640 × 396 pixels | 972 × 601 pixels.
Original file (972 × 601 pixels, file size: 21 KB, MIME type: image/png)
Captions
Captions
Add a one-line explanation of what this file represents
Summary[edit]
| Description |
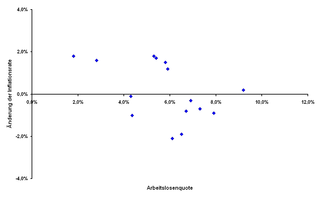
Deutsch: Dieses Diagramm stellt die Beziehung von Veränderungen der Inflationsrate und der Arbeitslosenquote für die Jahre seit 1980 für Deutschland dar. Siehe Phillips-Kurve. |
| Date | 16 May 2008 (original upload date) |
| Source | In Anlehnung an Blanchard, Olivier; Illing, Gerhard: Makroökonomie, 3. Auflage, München 2004 |
| Author |
Blanchard, Olivier; Illing, Gerhard: Makroökonomie, 3. Auflage, München 2004. Original uploader was Anja Müller-Ziermann. |
| This is a retouched picture, which means that it has been digitally altered from its original version. Modifications: converted to png, removed jpeg artifacts. Modifications made by Saibo. The original can be found here: see file history.
|
Licensing[edit]

|
The copyright holder of this work allows anyone to use it for any purpose including unrestricted redistribution, commercial use, and modification.
Usage notes:
|
Original upload log[edit]
The original description page was here. All following user names refer to de.wikipedia.
- 2008-05-16 12:53 Anja Müller-Ziermann 972×601× (23228 bytes) {{Information |Beschreibung = Der Zusammenhang zwischen der Veränderung der Inflationsrate und der Arbeitslosigkeit |Quelle = In Anlehnung an Blanchard, Olivier; Illing, Gerhard: Makroökonomie, 3. Auflage, München 2004 |Urheber = Blanchard, Olivier; I
File history
Click on a date/time to view the file as it appeared at that time.
| Date/Time | Thumbnail | Dimensions | User | Comment | |
|---|---|---|---|---|---|
| current | 18:32, 10 May 2011 | | 972 × 601 (21 KB) | Saibo (talk | contribs) | transparent background (checkerbox) is maybe to distracting |
| 18:32, 10 May 2011 |  | 972 × 601 (20 KB) | Saibo (talk | contribs) | removed jpeg artifacts, transparent background | |
| 18:30, 10 May 2011 |  | 972 × 601 (50 KB) | Saibo (talk | contribs) | == {{int:filedesc}} == {{Information |Description= {{de|Dieses Diagramm stellt die Beziehung von Veränderungen der Inflationsrate und der Arbeitslosenquote für die Jahre seit 1980 für Deutschland dar. Siehe Phillips-Kurve.}} |Sou |
You cannot overwrite this file.
File usage on Commons
There are no pages that use this file.
File usage on other wikis
The following other wikis use this file:
- Usage on de.wikipedia.org