File:Default-network-graph-maturation.jpeg
Original file (3,006 × 2,827 pixels, file size: 588 KB, MIME type: image/jpeg)
Captions
Captions
| Description |
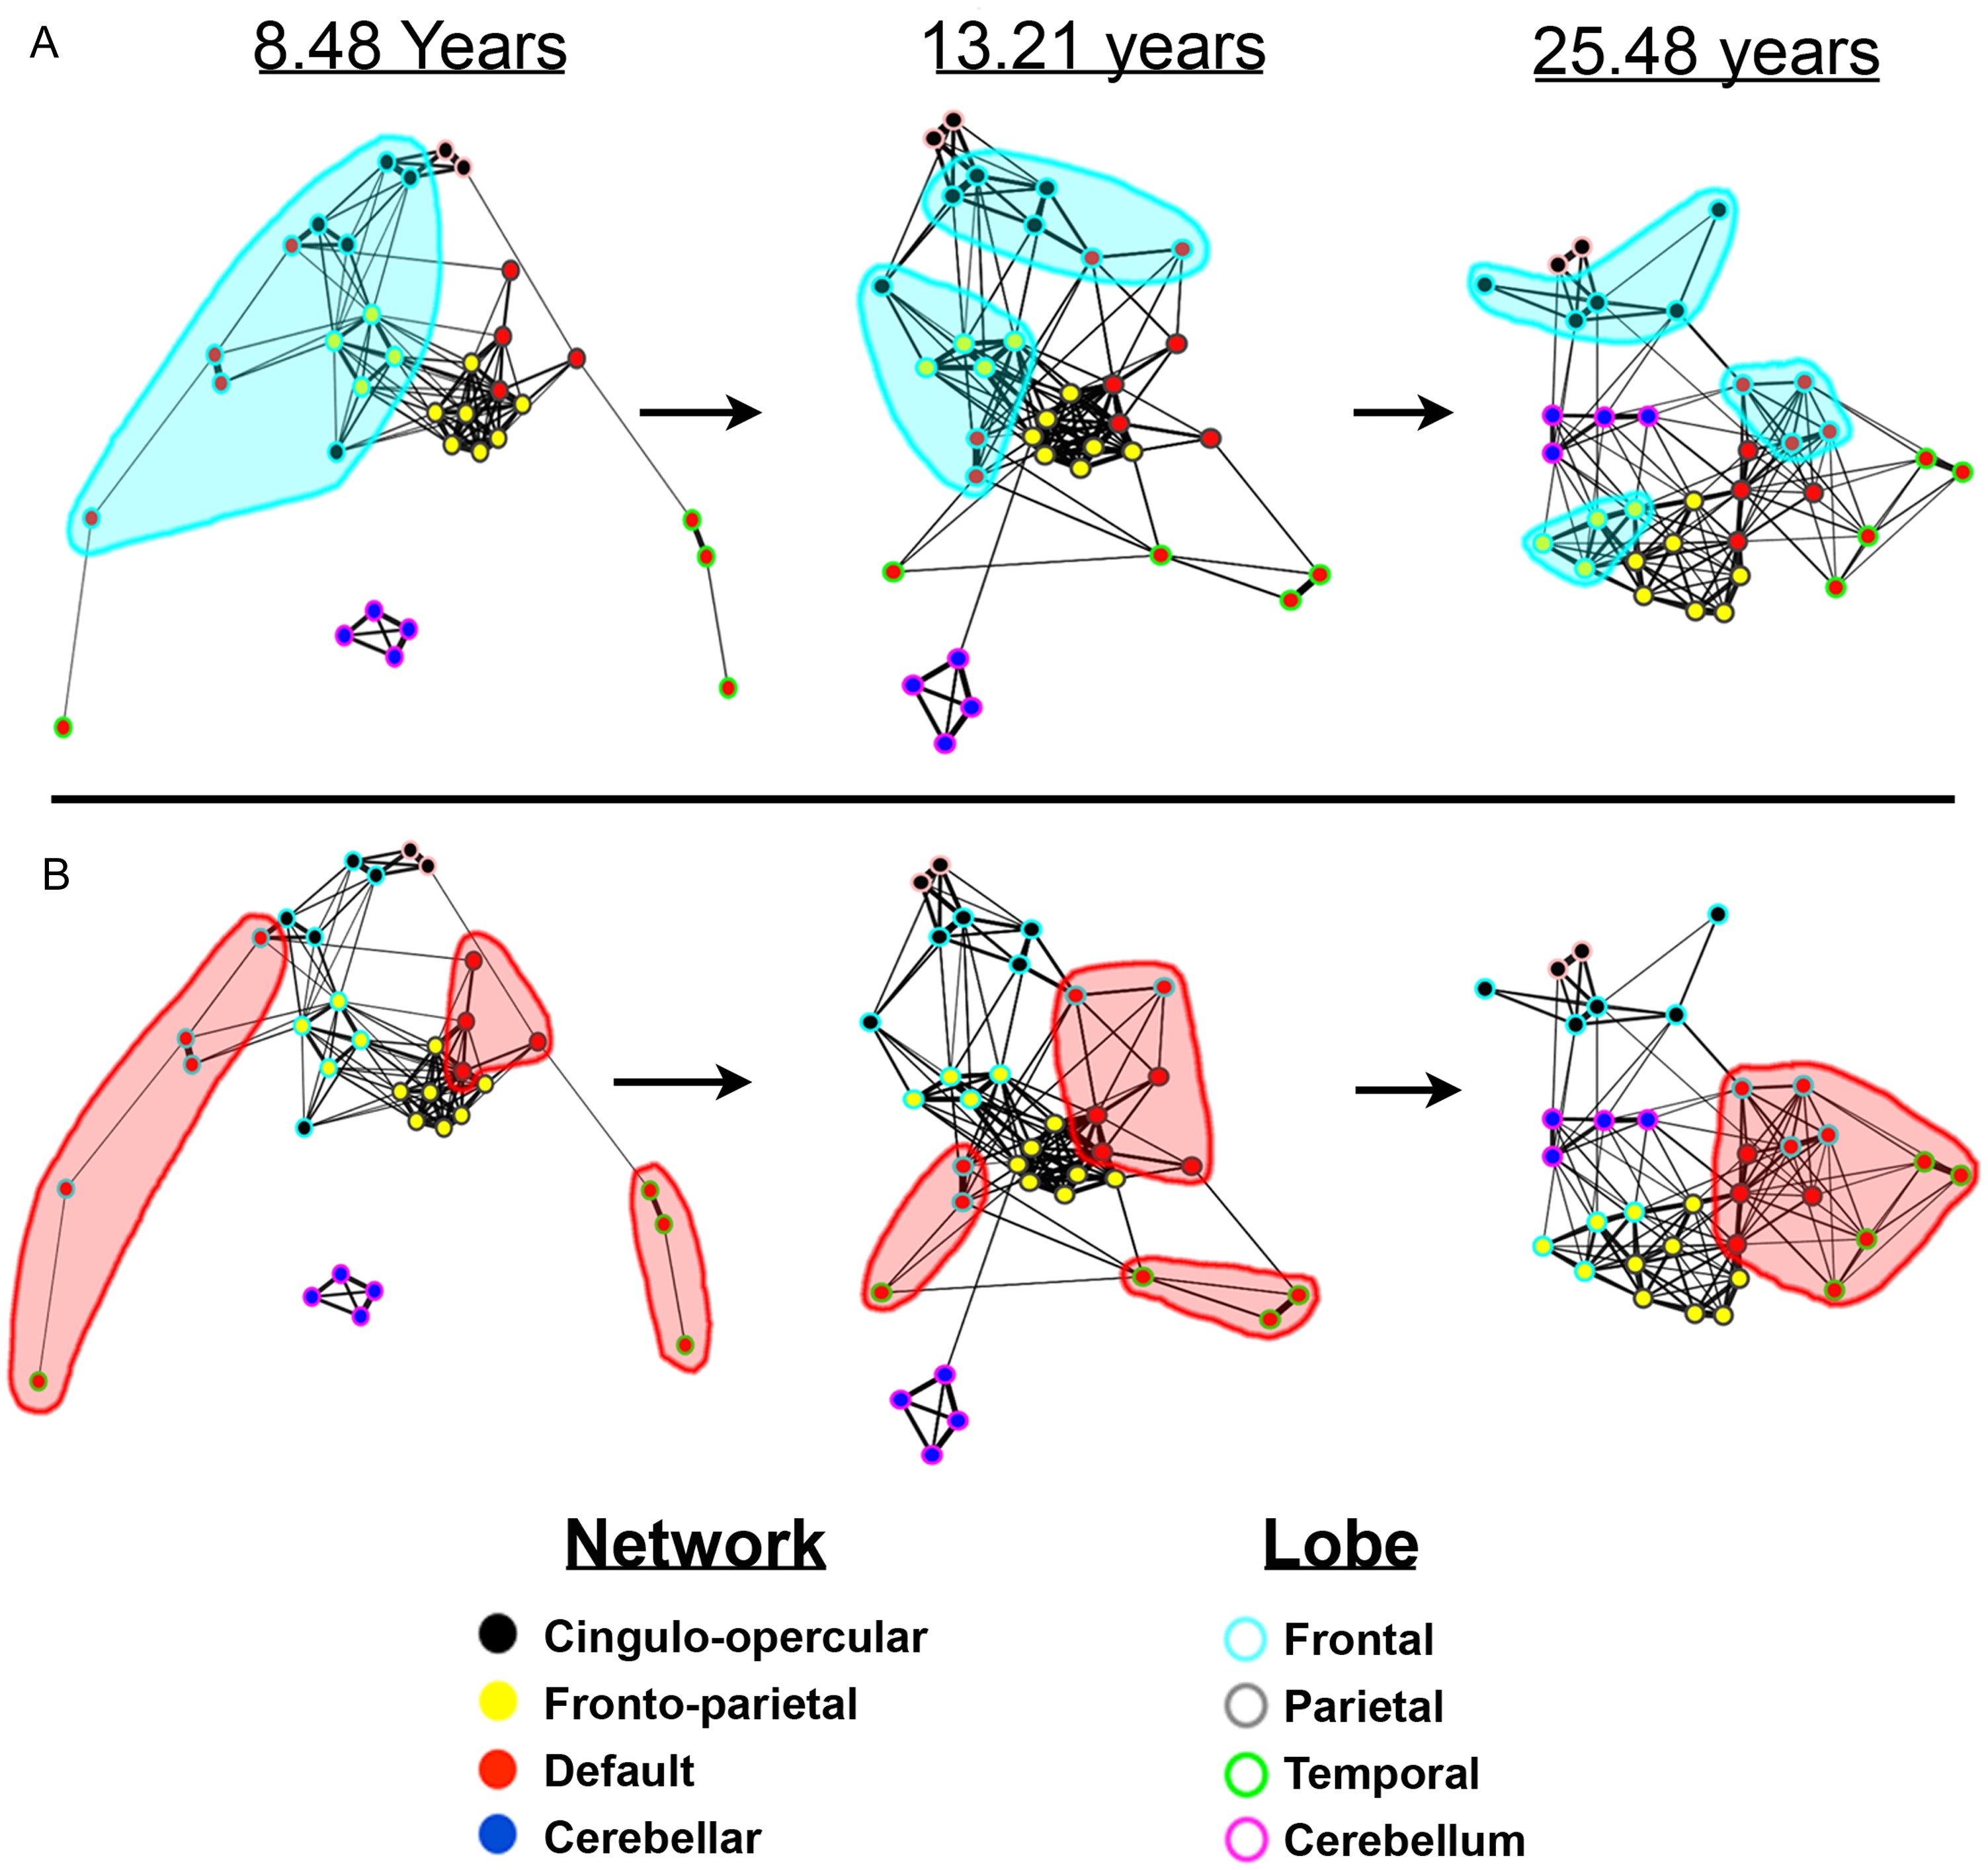
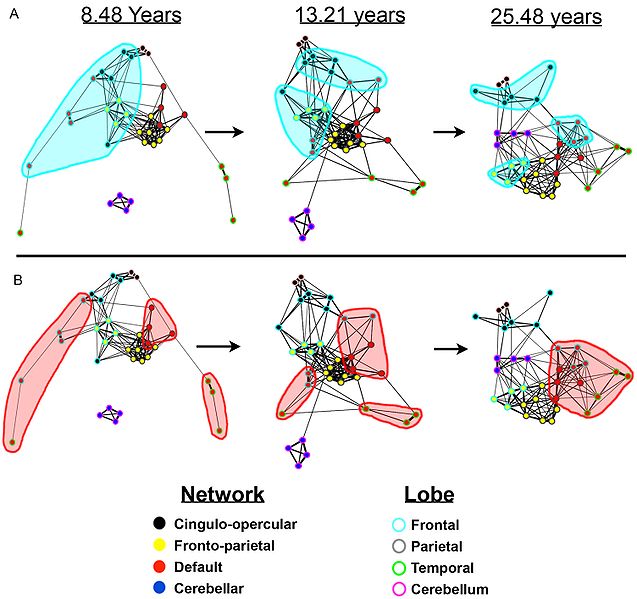
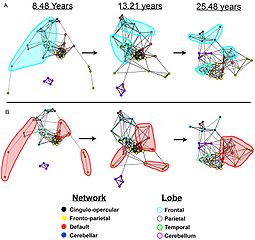
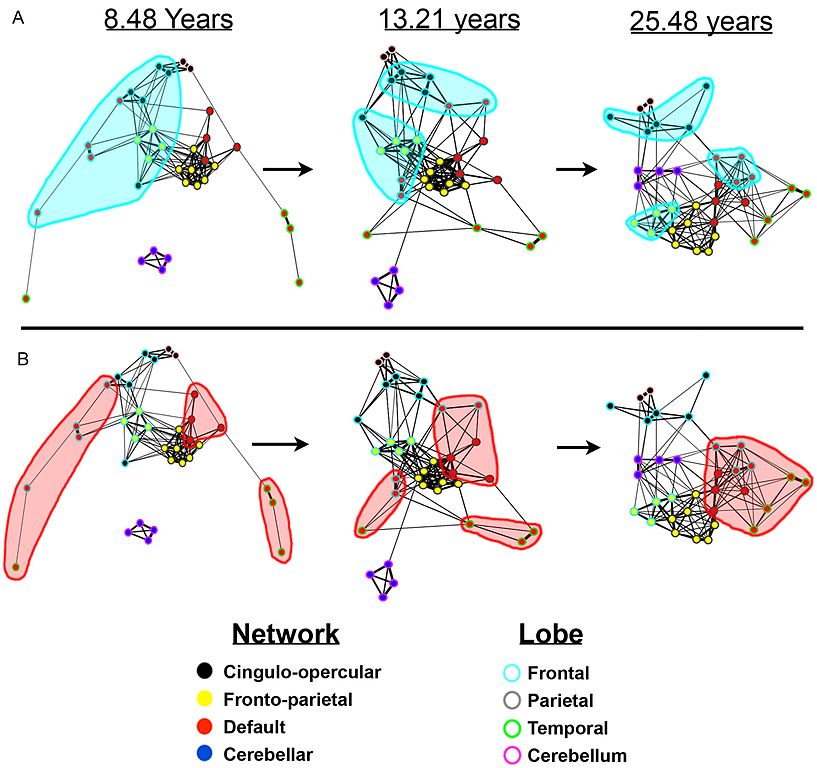
"Over age the graph architecture matures from a “local” organization to a “distributed” organization. In this figure we show the dynamic development and interaction of positive correlations between the two task control networks, the default network, and cerebellar network using spring embedding. The figure highlights the segregation of local, anatomically clustered regions and the integration of functional networks over development. A and B represent individual screen shots (at average ages 8.48, 13.21, and 25.48 years) of dynamic movies (Video S1) of the transition in the network architecture from child to adult ages. Nodes are color coded by their adult network profile (core of the nodes) and also by their anatomical location (node outlines). Black – cingulo-opercular network; Yellow – fronto-parietal network; Red – default network; Blue – cerebellar network; Light blue – frontal cortex; Grey – parietal cortex; Green - temporal cortex, Pink – cerebellum, Light pink – thalamus. Connections with r≥0.1 were considered connected. (A) In children regions are largely organized by their anatomical location, but over age anatomically clustered regions segregate. The cluster of frontal regions (highlighted in light blue) best demonstrates this segregation. (B) In children the more distributed adult functional networks are in many ways disconnected. Over development the functional networks integrate. The isolated regions of the default mode network in childhood (highlighted in light red) that coalesce into a highly correlated network best illustrate this integration. Over age node organization shifts from the “local” arrangement in children to the “distributed” organization commonly observed in adults." (The preceding description is quoted from the source.) |
| Date | |
| Source | Figure 2 (doi:10.1371/journal.pcbi.1000381.g002) of: Fair DA, Cohen AL, Power JD et al. (2009). "Functional brain networks develop from a 'local to distributed' organization". PLoS Comput Biol 5 (5): e1000381. DOI:10.1371/journal.pcbi.1000381. PMID 19412534. PMC: 2671306. |
| Author | Damien A. Fair, Alexander L. Cohen, Jonathan D. Power, Bradley L. Schlaggar, Steven E. Petersen |
| Permission (Reusing this file) |
CC-BY-2.5 [1] |
- You are free:
- to share – to copy, distribute and transmit the work
- to remix – to adapt the work
- Under the following conditions:
- attribution – You must give appropriate credit, provide a link to the license, and indicate if changes were made. You may do so in any reasonable manner, but not in any way that suggests the licensor endorses you or your use.
File history
Click on a date/time to view the file as it appeared at that time.
| Date/Time | Thumbnail | Dimensions | User | Comment | |
|---|---|---|---|---|---|
| current | 06:59, 18 May 2009 | | 3,006 × 2,827 (588 KB) | Eubulides (talk | contribs) | {{Information |Description="Over age the graph architecture matures from a “local” organization to a “distributed” organization. In this figure we show the dynamic development and interaction of positive correlations between the two task control |
You cannot overwrite this file.
File usage on Commons
There are no pages that use this file.
File usage on other wikis
The following other wikis use this file:
- Usage on en.wikipedia.org
- Usage on he.wikipedia.org
- Usage on it.wikipedia.org
- Usage on pt.wikipedia.org
- Usage on zh.wikipedia.org