File:DT fusion rxnrate.svg
Jump to navigation
Jump to search

Size of this PNG preview of this SVG file: 360 × 324 pixels. Other resolutions: 267 × 240 pixels | 533 × 480 pixels | 853 × 768 pixels | 1,138 × 1,024 pixels | 2,276 × 2,048 pixels.
Original file (SVG file, nominally 360 × 324 pixels, file size: 12 KB)
Captions
Captions
Add a one-line explanation of what this file represents
Summary[edit]
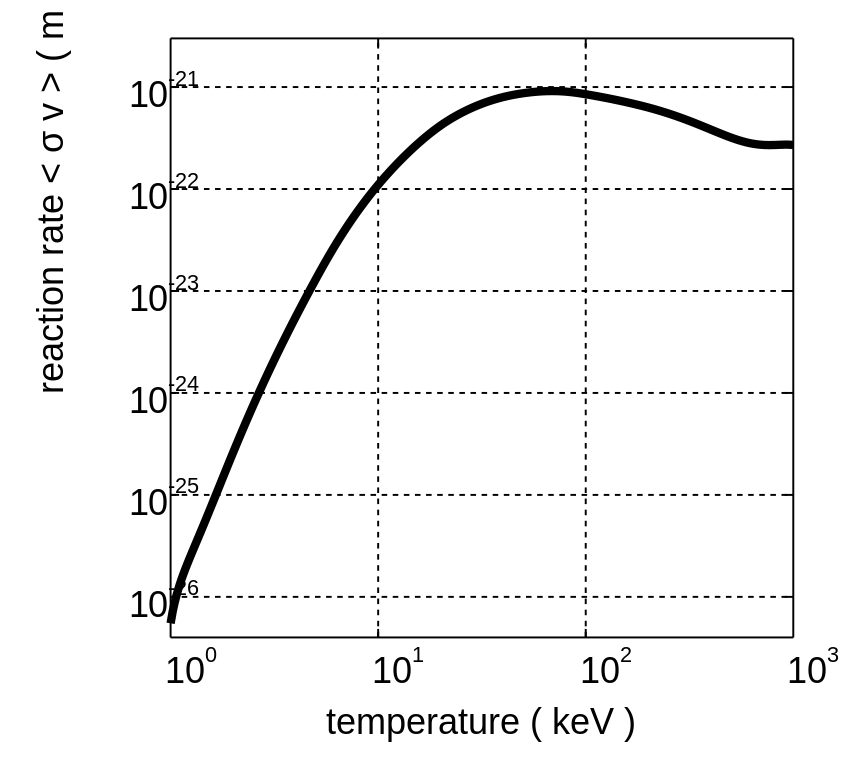
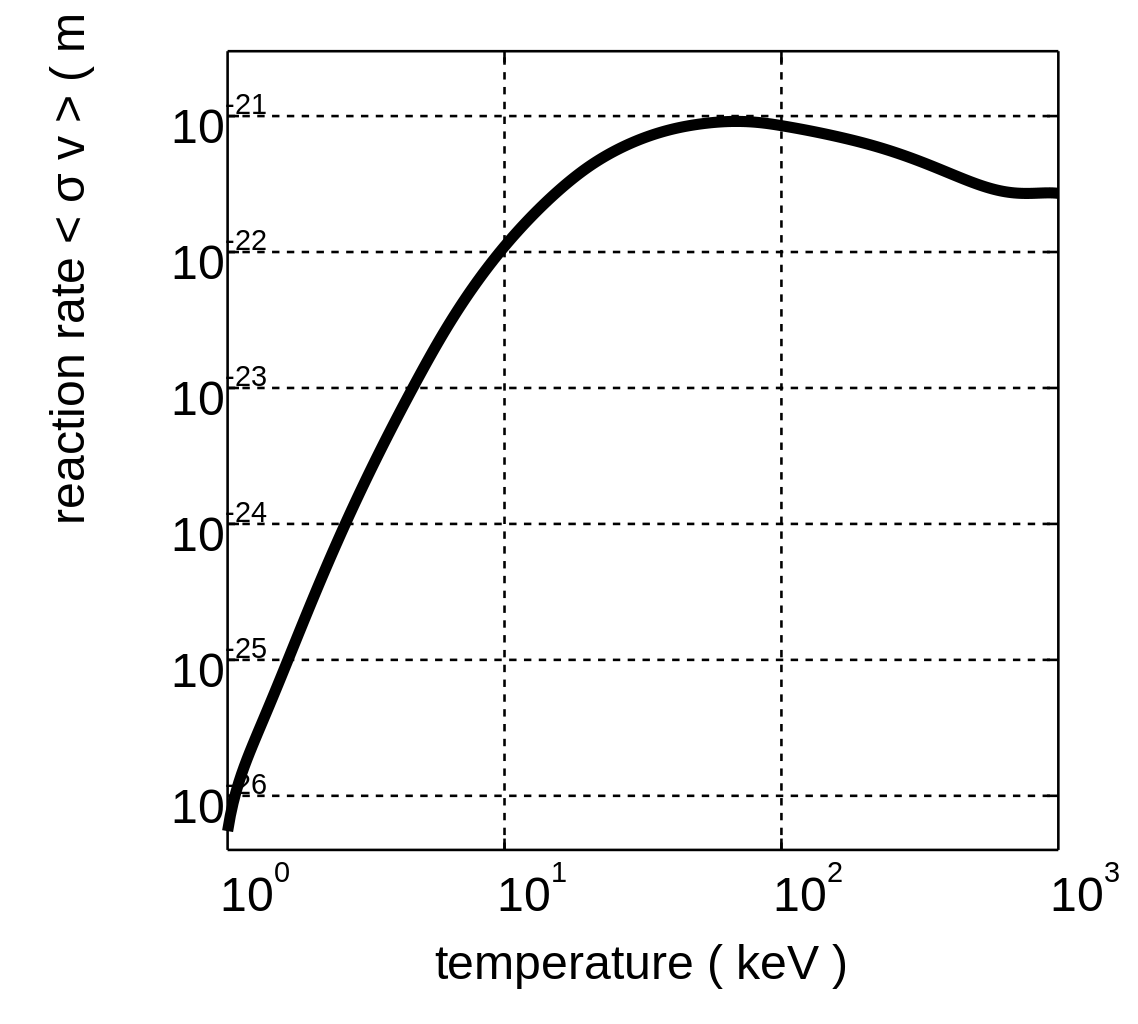
Logarithmic plot of the deuteron-triton fusion reaction rate <σv>, for Maxwellian ion velocity distributions with the same temperature. Created on 10 December 2005 by David Strozzi using Matlab. The curve is a spline interpolation through the data points included on p. 45 of the 2000 revision of the "NRL Plasma Formulary."
Licensing[edit]
This file is licensed under the Creative Commons Attribution-Share Alike 2.5 Generic license.
- You are free:
- to share – to copy, distribute and transmit the work
- to remix – to adapt the work
- Under the following conditions:
- attribution – You must give appropriate credit, provide a link to the license, and indicate if changes were made. You may do so in any reasonable manner, but not in any way that suggests the licensor endorses you or your use.
- share alike – If you remix, transform, or build upon the material, you must distribute your contributions under the same or compatible license as the original.
File history
Click on a date/time to view the file as it appeared at that time.
| Date/Time | Thumbnail | Dimensions | User | Comment | |
|---|---|---|---|---|---|
| current | 00:15, 12 December 2005 | | 360 × 324 (12 KB) | Dstrozzi~commonswiki (talk | contribs) | Logarithmic plot of the deuteron-triton fusion reaction rate <σv>, for Maxwellian ion velocity distributions with the same temperature. Created on 11 December 2005 by David Strozzi using Matlab. The curve is a spline interpolation through the data |
| 22:01, 10 December 2005 |  | 270 × 234 (12 KB) | Dstrozzi~commonswiki (talk | contribs) | Logarithmic plot of the deuteron-triton fusion reaction rate <σv>, for Maxwellian ion velocity distributions with the same temperature. Created on 10 December 2005 by David Strozzi using Matlab. The curve is a spline interpolation through the data | |
| 20:19, 10 December 2005 | 270 × 3 (12 KB) | Dstrozzi~commonswiki (talk | contribs) | Logarithmic plot of the deuteron-triton fusion reaction rate <σv>, for Maxwellian ion velocity distributions with the same temperature. Created on 10 December 2005 by David Strozzi using Matlab. The curve is a spline interpolation through the data | ||
| 19:52, 10 December 2005 | 270 × 3 (12 KB) | Dstrozzi~commonswiki (talk | contribs) | Logarithmic plot of the deuteron-triton fusion reaction rate <σv>, for Maxwellian ion velocity distributions with the same temperature. Created on 10 December 2005 by David Strozzi using Matlab. The curve is a spline interpolation through the data | ||
| 07:24, 10 December 2005 |  | 512 × 333 (12 KB) | Dstrozzi~commonswiki (talk | contribs) | Logarithmic plot of the deuteron-triton fusion reaction rate <v>, for Maxwellian ion velocity distributions with the same temperature. Created on 9 December 2005 by David Strozzi using Matlab. The curve is a spline interpolation through the data points i |
You cannot overwrite this file.
File usage on Commons
The following page uses this file:
File usage on other wikis
The following other wikis use this file:
- Usage on bs.wikipedia.org
- Usage on eo.wikipedia.org
- Usage on es.wikipedia.org
- Usage on fr.wikibooks.org
- Usage on hr.wikipedia.org
- Usage on ko.wikipedia.org
- Usage on no.wikipedia.org
- Usage on pt.wikipedia.org
- Usage on sh.wikipedia.org
- Usage on sr.wikipedia.org