File:Csv-bivariate-normal-distribution.svg
Jump to navigation
Jump to search

Size of this PNG preview of this SVG file: 296 × 599 pixels. Other resolutions: 118 × 240 pixels | 237 × 480 pixels | 379 × 768 pixels | 506 × 1,024 pixels | 1,012 × 2,048 pixels | 640 × 1,295 pixels.
Original file (SVG file, nominally 640 × 1,295 pixels, file size: 2.65 MB)
Captions
Captions
Add a one-line explanation of what this file represents
Summary[edit]
| Description |
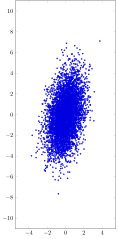
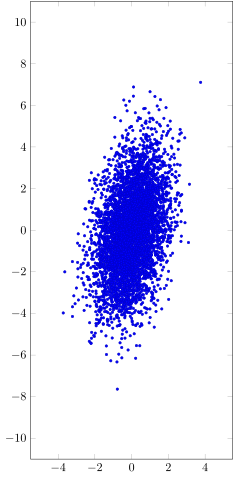
English: 5000 samples of a bivariate normal distribution with variances 1 and 4 and rho=0.7
Deutsch: 5000 Datenpunkte einer Bivariaten Normalverteilung mit der Kovarianzmatrix 1.0, 0.7, [0.7, 4.0] und dem mittelwertsvektor [0.0, 0.0] |
| Date | |
| Source | Own work |
| Author | MartinThoma |
W3C-validity not checked.
Source is available at github
#!/usr/bin/env python
# -*- coding: utf-8 -*-

"""Create samples for bivariate distribution."""

from numpy.random import multivariate_normal, seed


def create_data(n):
    means = [0.0, 0.0]
    cov = [[1.0, 0.7], [0.7, 4.0]]
    seed(0)
    samples = multivariate_normal(means, cov, n)
    with open("data.csv", "w") as f:
        f.write("x,y\n")
        for datapoint in samples:
            f.write("%0.4f,%0.4f\n" % tuple(datapoint))


def get_parser():
    from argparse import ArgumentParser, ArgumentDefaultsHelpFormatter
    parser = ArgumentParser(description=__doc__,
                            formatter_class=ArgumentDefaultsHelpFormatter)
    parser.add_argument("-n",
                        dest="n",
                        default=5000,
                        type=int,
                        help="Number of points to generate")
    return parser


if __name__ == "__main__":
    args = get_parser().parse_args()
    create_data(args.n)
\documentclass[varwidth=true, border=2pt]{standalone}
\usepackage[utf8]{inputenc} % this is needed for umlauts
\usepackage[ngerman]{babel} % this is needed for umlauts
\usepackage[T1]{fontenc}    % this is needed for correct output of umlauts in pdf
\usepackage[margin=2.5cm]{geometry} %layout

\usepackage{pgfplots}
\pgfplotsset{compat=newest}
\usetikzlibrary{plotmarks}

\begin{document}
\tikzset{mark options={line width=0.5pt}}
\begin{tikzpicture}
    \begin{axis}[
            width=7.5cm, height=15cm,     % size of the image
            enlarge x limits=0.05,
            enlarge y limits=0.05,
            xmin = -5,
            xmax = 5,
            ymin = -10,
            ymax = 10,
            % xlabel=x,
            % ylabel=y
         ]
          \addplot[scatter,
                   only marks,
                   mark=*,
                   mark size = 1,
                   point meta=1,
                   ]
                   table [x=x, y=y, col sep=comma] {data.csv};
    \end{axis}
\end{tikzpicture}
\end{document}
Licensing[edit]
I, the copyright holder of this work, hereby publish it under the following license:
| This file is made available under the Creative Commons CC0 1.0 Universal Public Domain Dedication. | |
| The person who associated a work with this deed has dedicated the work to the public domain by waiving all of their rights to the work worldwide under copyright law, including all related and neighboring rights, to the extent allowed by law. You can copy, modify, distribute and perform the work, even for commercial purposes, all without asking permission.
|
File history
Click on a date/time to view the file as it appeared at that time.
| Date/Time | Thumbnail | Dimensions | User | Comment | |
|---|---|---|---|---|---|
| current | 14:52, 8 September 2015 | | 640 × 1,295 (2.65 MB) | MartinThoma (talk | contribs) | {{Information |Description ={{en|1=5000 samples of a bivariate normal distribution with variances 1 and 4 and rho=0.7}} {{de|1=5000 Datenpunkte einer Bivariaten Normalverteilung mit der Kovarianzmatrix 1.0, 0.7, [0.7, 4.0] und dem mittelwertsvek... |
You cannot overwrite this file.
File usage on Commons
The following page uses this file:
File usage on other wikis
The following other wikis use this file: