File:Constant gaussian curvature.svg
Jump to navigation
Jump to search

Size of this PNG preview of this SVG file: 501 × 453 pixels. Other resolutions: 265 × 240 pixels | 531 × 480 pixels | 849 × 768 pixels | 1,133 × 1,024 pixels | 2,265 × 2,048 pixels.
Original file (SVG file, nominally 501 × 453 pixels, file size: 568 KB)
Captions
Captions
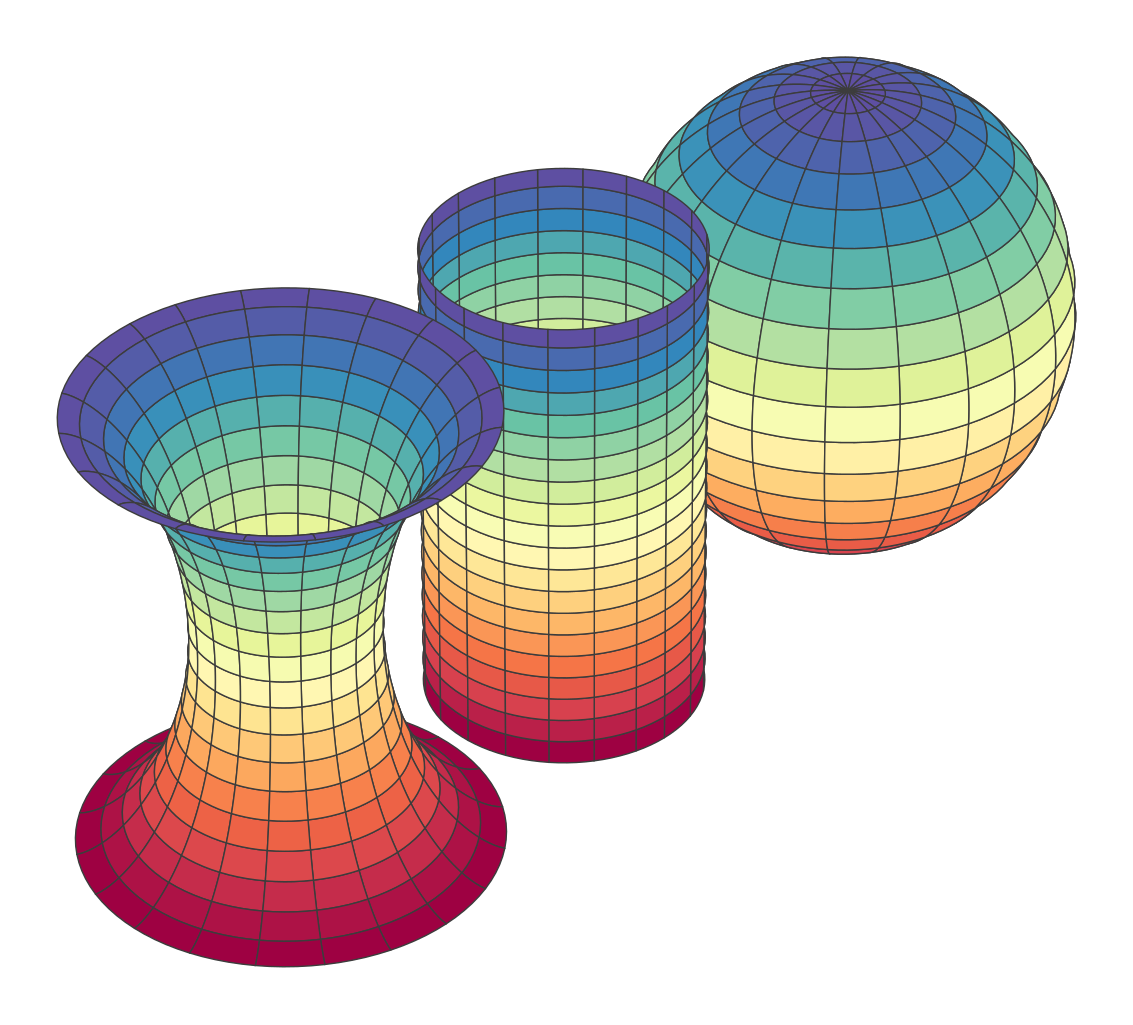
Surfaces with constant Gaussian curvature
Summary[edit]
| Description |
English: Surfaces with constant Gaussian curvature. From left to right: a surface of negative Gaussian curvature, a surface of zero Gaussian curvature (cylinder), and a surface of positive Gaussian curvature (sphere). The surface of negative curvature given by
Español: Superficies de curvatura gaussiana constante. De izquierda a derecha: una superficie con curvatura gaussiana negativa, una superficie con curvatura gaussiana cero (cilindro), y una superficie con curvatura gaussiana positiva (esfera). La superficie de curvatura negativa está dada por
|
| Date | |
| Source | Own work |
| Author | Nicoguaro |
| SVG development | This plot was created with Matplotlib. |
| Source code | Python code"""
Examples of surfaces with constant Gaussian curvature.
Created with Matplotlib 3.4.3.
"""
import numpy as np
from numpy import pi, cos, sin, sqrt, outer, ones, sinh, cosh
from scipy.integrate import quad
import matplotlib.pyplot as plt
fig = plt.figure(figsize=(10, 10))
ax = fig.add_subplot(111, projection='3d')
u = np.linspace(0, 2 * pi, 100)
v = np.linspace(0, pi, 100)
one_v = ones(100)
# Sphere
x1 = 10 * outer(cos(u), sin(v))
y1 = 10 * outer(sin(u), sin(v)) + 17
z1 = 10 * outer(one_v, cos(v))
ax.plot_surface(x1, y1, z1, rstride=5, cstride=5, cmap='Spectral',
linewidth=0.5, edgecolors="#3c3c3c")
# Cylinder
x2 = 6 * outer(cos(u), one_v)
y2 = 6 * outer(sin(u), one_v)
z2 = 20 * outer(one_v, v/pi - 0.5)
ax.plot_surface(x2, y2, z2, rstride=5, cstride=5, cmap='Spectral',
linewidth=0.5, edgecolors="#3c3c3c")
# Negative Gaussian curvature
u = np.linspace(-pi, pi, 100)
v = np.linspace(-1.4436, 1.4436, 100)
aux = np.zeros_like(v)
for cont, val in enumerate(v):
aux[cont] = quad(lambda t: sqrt(1 - 0.25*sinh(t)**2), 0, val)[0]
x3 = 4 * outer(cos(u), cosh(v))
y3 = 4 * outer(sin(u), cosh(v)) - 16
z3 = 8 * outer(one_v, aux)
ax.plot_surface(x3, y3, z3, rstride=5, cstride=5, cmap='Spectral',
linewidth=0.5, edgecolors="#3c3c3c")
# Fix aspect ratio and axes details
ax.set_box_aspect((np.ptp(np.column_stack((x1, x2, x3))),
np.ptp(np.column_stack((y1, y2, y3))),
np.ptp(np.column_stack((z1, z2, z3)))))
ax.view_init(elev=35, azim=-45)
plt.axis('off')
plt.savefig('Constant gaussian curvature.svg', transparent=True)
plt.show()
|

Licensing[edit]
I, the copyright holder of this work, hereby publish it under the following license:
This file is licensed under the Creative Commons Attribution 4.0 International license.
- You are free:
- to share – to copy, distribute and transmit the work
- to remix – to adapt the work
- Under the following conditions:
- attribution – You must give appropriate credit, provide a link to the license, and indicate if changes were made. You may do so in any reasonable manner, but not in any way that suggests the licensor endorses you or your use.
File history
Click on a date/time to view the file as it appeared at that time.
| Date/Time | Thumbnail | Dimensions | User | Comment | |
|---|---|---|---|---|---|
| current | 20:04, 11 July 2022 | | 501 × 453 (568 KB) | Nicoguaro (talk | contribs) | Reduce negative space |
| 19:59, 11 July 2022 |  | 900 × 900 (723 KB) | Nicoguaro (talk | contribs) | Uploaded own work with UploadWizard |
You cannot overwrite this file.
File usage on Commons
The following page uses this file:
File usage on other wikis
The following other wikis use this file:
- Usage on ca.wikipedia.org
- Usage on de.wikipedia.org
- Usage on en.wikipedia.org
- Usage on ja.wikipedia.org