File:Chernobyl radiation map 1996-fi.svg
Jump to navigation
Jump to search

Size of this PNG preview of this SVG file: 568 × 600 pixels. Other resolutions: 227 × 240 pixels | 455 × 480 pixels | 727 × 768 pixels | 970 × 1,024 pixels | 1,940 × 2,048 pixels | 1,398 × 1,476 pixels.
Original file (SVG file, nominally 1,398 × 1,476 pixels, file size: 443 KB)
Captions
Captions
Add a one-line explanation of what this file represents
| Description |
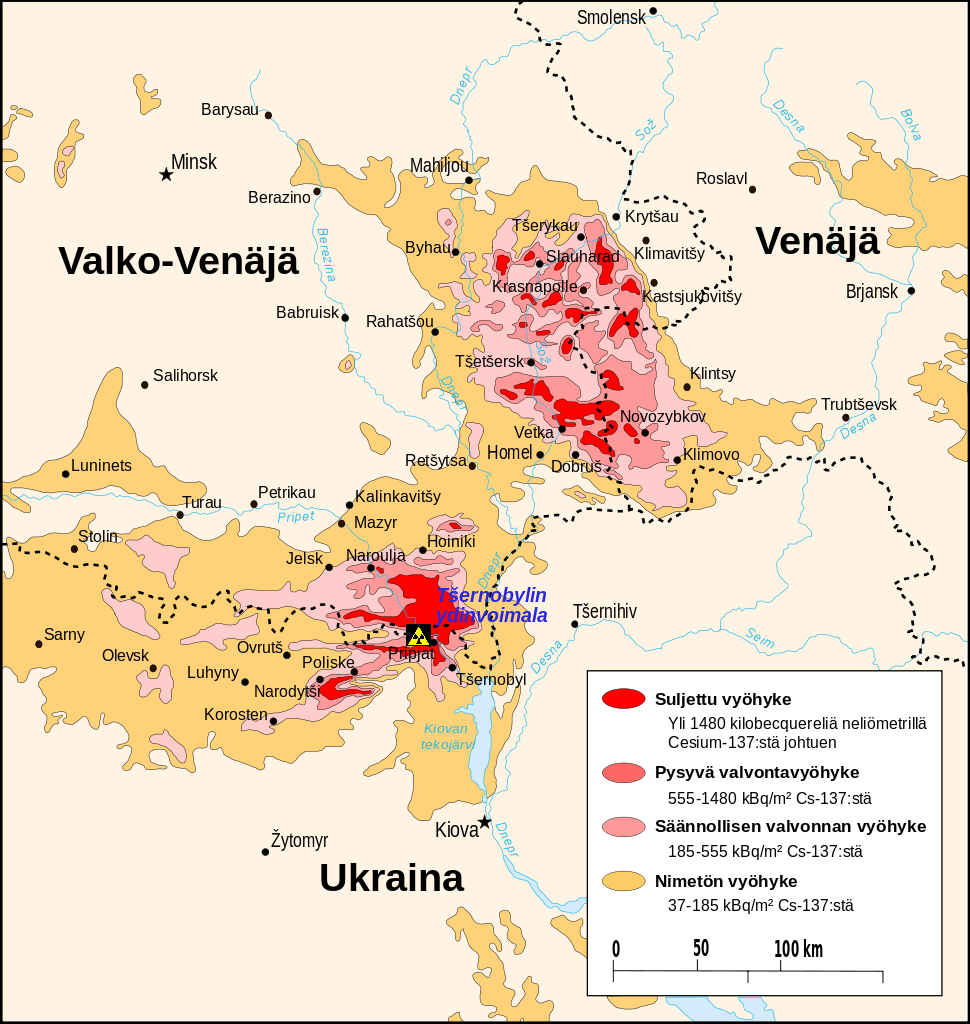
Chernobyl radiation map from CIA handbook, svg'd by User:Sting. Old radiation units and scale were updated into SI-units (conversion 1 Ci/km2= 37 kBq/m2), some towns were added, whereas some minor ones were deleted elsewhere, geographical names translated in Finnish (romanization based on local Belarusian, Russian and Ukrainian names; several errors in the previous map corrected) in cases when commonly accepted Finnish name was missing. (For verification of radiation units, you could see e.g. http://www.unscear.org/unscear/en/chernobylmaps.html). I used Inkscape and WordPad as tools. |
| Date | (UTC) |
| Source | |
| Author |
|
| This is a retouched picture, which means that it has been digitally altered from its original version. Modifications: units into SI, language in Finnish, some towns added/ removed. The original can be viewed here: Chernobyl radiation map 1996.svg:
|
I, the copyright holder of this work, hereby publish it under the following license:
This file is licensed under the Creative Commons Attribution-Share Alike 2.5 Generic license.
- You are free:
- to share – to copy, distribute and transmit the work
- to remix – to adapt the work
- Under the following conditions:
- attribution – You must give appropriate credit, provide a link to the license, and indicate if changes were made. You may do so in any reasonable manner, but not in any way that suggests the licensor endorses you or your use.
- share alike – If you remix, transform, or build upon the material, you must distribute your contributions under the same or compatible license as the original.
Original upload log[edit]
This image is a derivative work of the following images:
- File:Chernobyl_radiation_map_1996.svg licensed with Cc-by-sa-2.5
- 2009-04-29T03:58:00Z 84user 1398x1476 (427923 Bytes) Neither Firefox nor Opera would render town circles in previous version, so I opened it in InkScape, selected town "layer", minimally moved one node and saved.
- 2007-08-25T22:29:32Z Mtruch 1398x1476 (427534 Bytes) {{Information |Description=Chernobyl radiation map from CIA handbook, svg'd by [[User:Sting]], and re-anglified by me (to the same strange names used in the original). |Source= |Date= |Author= |Permission= |other_versions=[
Uploaded with derivativeFX
File history
Click on a date/time to view the file as it appeared at that time.
| Date/Time | Thumbnail | Dimensions | User | Comment | |
|---|---|---|---|---|---|
| current | 12:21, 10 December 2010 | | 1,398 × 1,476 (443 KB) | Paju~commonswiki (talk | contribs) | Renewed version, replacing the previous version in Finnish: 1. upper end of the activity scale for the unnamed zone (nimetön vyöhyke) was corrected to be 185 kBq/m<sup>2</sup> (using SI-scale, equals 5 Ci/km<sup>2</sup>). There was and still seems to b |
| 19:50, 9 December 2010 |  | 1,398 × 1,476 (433 KB) | Paju~commonswiki (talk | contribs) | {{Information |Description=Chernobyl radiation map from CIA handbook, svg'd by User:Sting. Old radiation units and scale were updated into SI-units (conversion 1 Ci/km2= 37 kBq/m2), some towns were added, whereas some minor ones were deleted elsewhe |
You cannot overwrite this file.
File usage on Commons
There are no pages that use this file.
File usage on other wikis
The following other wikis use this file:
- Usage on et.wikipedia.org
- Usage on fi.wikipedia.org
- Tšernobylin ydinvoimalaonnettomuus
- Brjanskin alue
- Žytomyrin alue
- Jelsk
- Mahiljoun alue
- Vetka
- Tšatšersk
- Krytšau
- Dobruš
- Novozybkov
- H’oiniki
- Naroulja
- Kastsjukovitšy
- Klimavitšy
- Tšerykau
- Slauharad
- Brahin
- Krasnapolle
- Krasnaja Gora
- Gordejevka
- Klimovo (Brjanskin alue)
- Polesian säteily-ekologinen suojelualue
- Tšernobylin suojavyöhyke