File:Changes in mean solar irradiance and mean global surface temperature on Earth since the year 1978.png
Jump to navigation
Jump to search

Size of this preview: 800 × 583 pixels. Other resolutions: 320 × 233 pixels | 640 × 467 pixels | 1,024 × 747 pixels | 1,392 × 1,015 pixels.
Original file (1,392 × 1,015 pixels, file size: 27 KB, MIME type: image/png)
Captions
Captions
Add a one-line explanation of what this file represents
Summary[edit]
| Description |
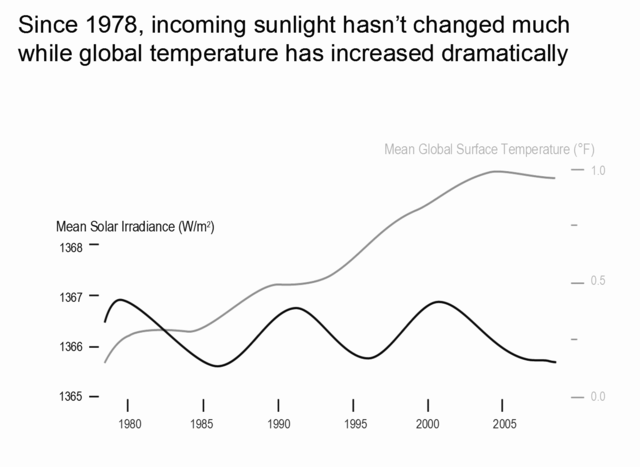
English: This graph shows changes in mean solar irradiance (measured in watts per square metre, W m-2) and mean global surface temperature (º F) since the year 1978. Data are presented on the graph almost up to the year 2010. From the source: "Since 1978 there has been no net increase in total solar irradiance [dark grey line] while global temperature has increased significantly [pale grey line]. Thus, climate scientists don’t think the global warming experienced over the last 30 years is due to an increase in incoming sunlight. Rather, they have evidence that the recent global warming is [caused] mainly by human activities." |
| Date | |
| Source | "Human Contributions to Global Climate Change." NOAA Climate Services website presentation library: http://www.climate.gov/#understandingClimate/presentationLibrary |
| Author | Robert Simmon and David Herring, NASA and NOAA |
| Permission (Reusing this file) |
"As required by 17 U.S.C. 403, third parties producing copyrighted works consisting predominantly of the material produced by U.S. government agencies must provide notice with such work(s) identifying the U.S. Government material incorporated and stating that such material is not subject to copyright protection within the United States. The information on government web pages is in the public domain and not subject to copyright protection within the United States unless specifically annotated otherwise (copyright may be held elsewhere). Foreign copyrights may apply." http://www.ngdc.noaa.gov/ngdcinfo/privacy.html |
| This is a retouched picture, which means that it has been digitally altered from its original version. Modifications: (1) adjusted colors, (2) altered contrast.
|
Licensing[edit]
This image is in the public domain because it contains materials that originally came from the U.S. National Oceanic and Atmospheric Administration, taken or made as part of an employee's official duties.
|
File history
Click on a date/time to view the file as it appeared at that time.
| Date/Time | Thumbnail | Dimensions | User | Comment | |
|---|---|---|---|---|---|
| current | 02:53, 23 June 2011 | | 1,392 × 1,015 (27 KB) | Enescot (talk | contribs) | {{Information |Description ={{en|1=This graph shows changes in mean solar irradiance (measured in watts per square metre, W m<sup>-2</sup>) and mean global surface temperature (º F) since the year 1978. Data are presented on the graph almost up t |
You cannot overwrite this file.
File usage on Commons
There are no pages that use this file.