File:Cape Town water graph Jan 2018.svg
Jump to navigation
Jump to search

Size of this PNG preview of this SVG file: 800 × 373 pixels. Other resolutions: 320 × 149 pixels | 640 × 299 pixels | 1,024 × 478 pixels | 1,280 × 597 pixels | 2,560 × 1,194 pixels | 986 × 460 pixels.
Original file (SVG file, nominally 986 × 460 pixels, file size: 140 KB)
Captions
Captions
Add a one-line explanation of what this file represents
Summary[edit]
| Description |
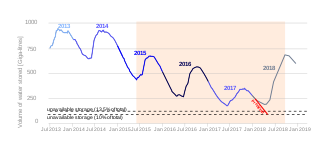
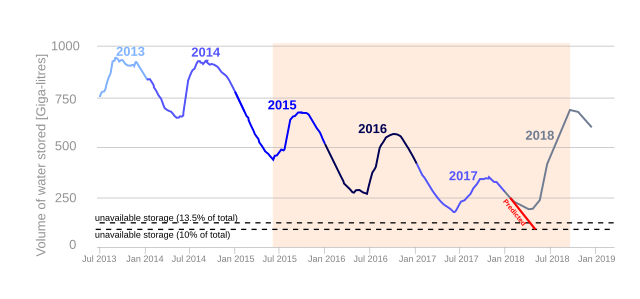
English: Graph of the total water stored in the Western Cape's largest six dams from 30 June 2013 to the 15 January 2018. The graph illustrates the declining water storage levels over the course of the Cape Town water crisis. Data obtained from the Climate Systems Analysis Group (SAGP): [1]
Euskara: Lurmutur Hiriko mendebaldeko sei presa nagusietan dagoen ur kopuruaren grafikoa 2013ko ekainetik 2018ko urtarrilera. Grafikoan ikus daiteke Lurmutur Hirian urte horietan egon zen lehortea eta udarako espero zuten idorte itzela. |
| Date | |
| Source | Own work |
| Author | Discott |
| Other versions |
Licensing[edit]
I, the copyright holder of this work, hereby publish it under the following license:
This file is licensed under the Creative Commons Attribution-Share Alike 4.0 International license.
- You are free:
- to share – to copy, distribute and transmit the work
- to remix – to adapt the work
- Under the following conditions:
- attribution – You must give appropriate credit, provide a link to the license, and indicate if changes were made. You may do so in any reasonable manner, but not in any way that suggests the licensor endorses you or your use.
- share alike – If you remix, transform, or build upon the material, you must distribute your contributions under the same or compatible license as the original.
File history
Click on a date/time to view the file as it appeared at that time.
| Date/Time | Thumbnail | Dimensions | User | Comment | |
|---|---|---|---|---|---|
| current | 20:38, 5 November 2020 | | 986 × 460 (140 KB) | Zaian (talk | contribs) | Move the "predicted" red line to show the Day Zero prediction |
| 16:03, 2 February 2019 |  | 986 × 460 (140 KB) | Discott (talk | contribs) | Updated with data from Jan 2019. Added drought period in orange | |
| 11:58, 19 May 2018 |  | 897 × 460 (34 KB) | Discott (talk | contribs) | Updated with data up until end of April 2018 | |
| 11:46, 25 January 2018 |  | 837 × 380 (34 KB) | Discott (talk | contribs) | Resized area | |
| 11:45, 25 January 2018 |  | 744 × 1,052 (33 KB) | Discott (talk | contribs) | User created page with UploadWizard |
You cannot overwrite this file.
File usage on Commons
There are no pages that use this file.
File usage on other wikis
The following other wikis use this file:
- Usage on af.wikipedia.org
- Usage on ast.wikipedia.org
- Usage on be.wikipedia.org
- Usage on de.wikipedia.org
- Usage on el.wikipedia.org
- Usage on en.wikipedia.org
- Usage on es.wikipedia.org
- Usage on eu.wikipedia.org
- Usage on fr.wikipedia.org
- Usage on gl.wikipedia.org
- Usage on he.wikipedia.org
- Usage on hy.wikipedia.org
- Usage on it.wikipedia.org
- Usage on ko.wikipedia.org